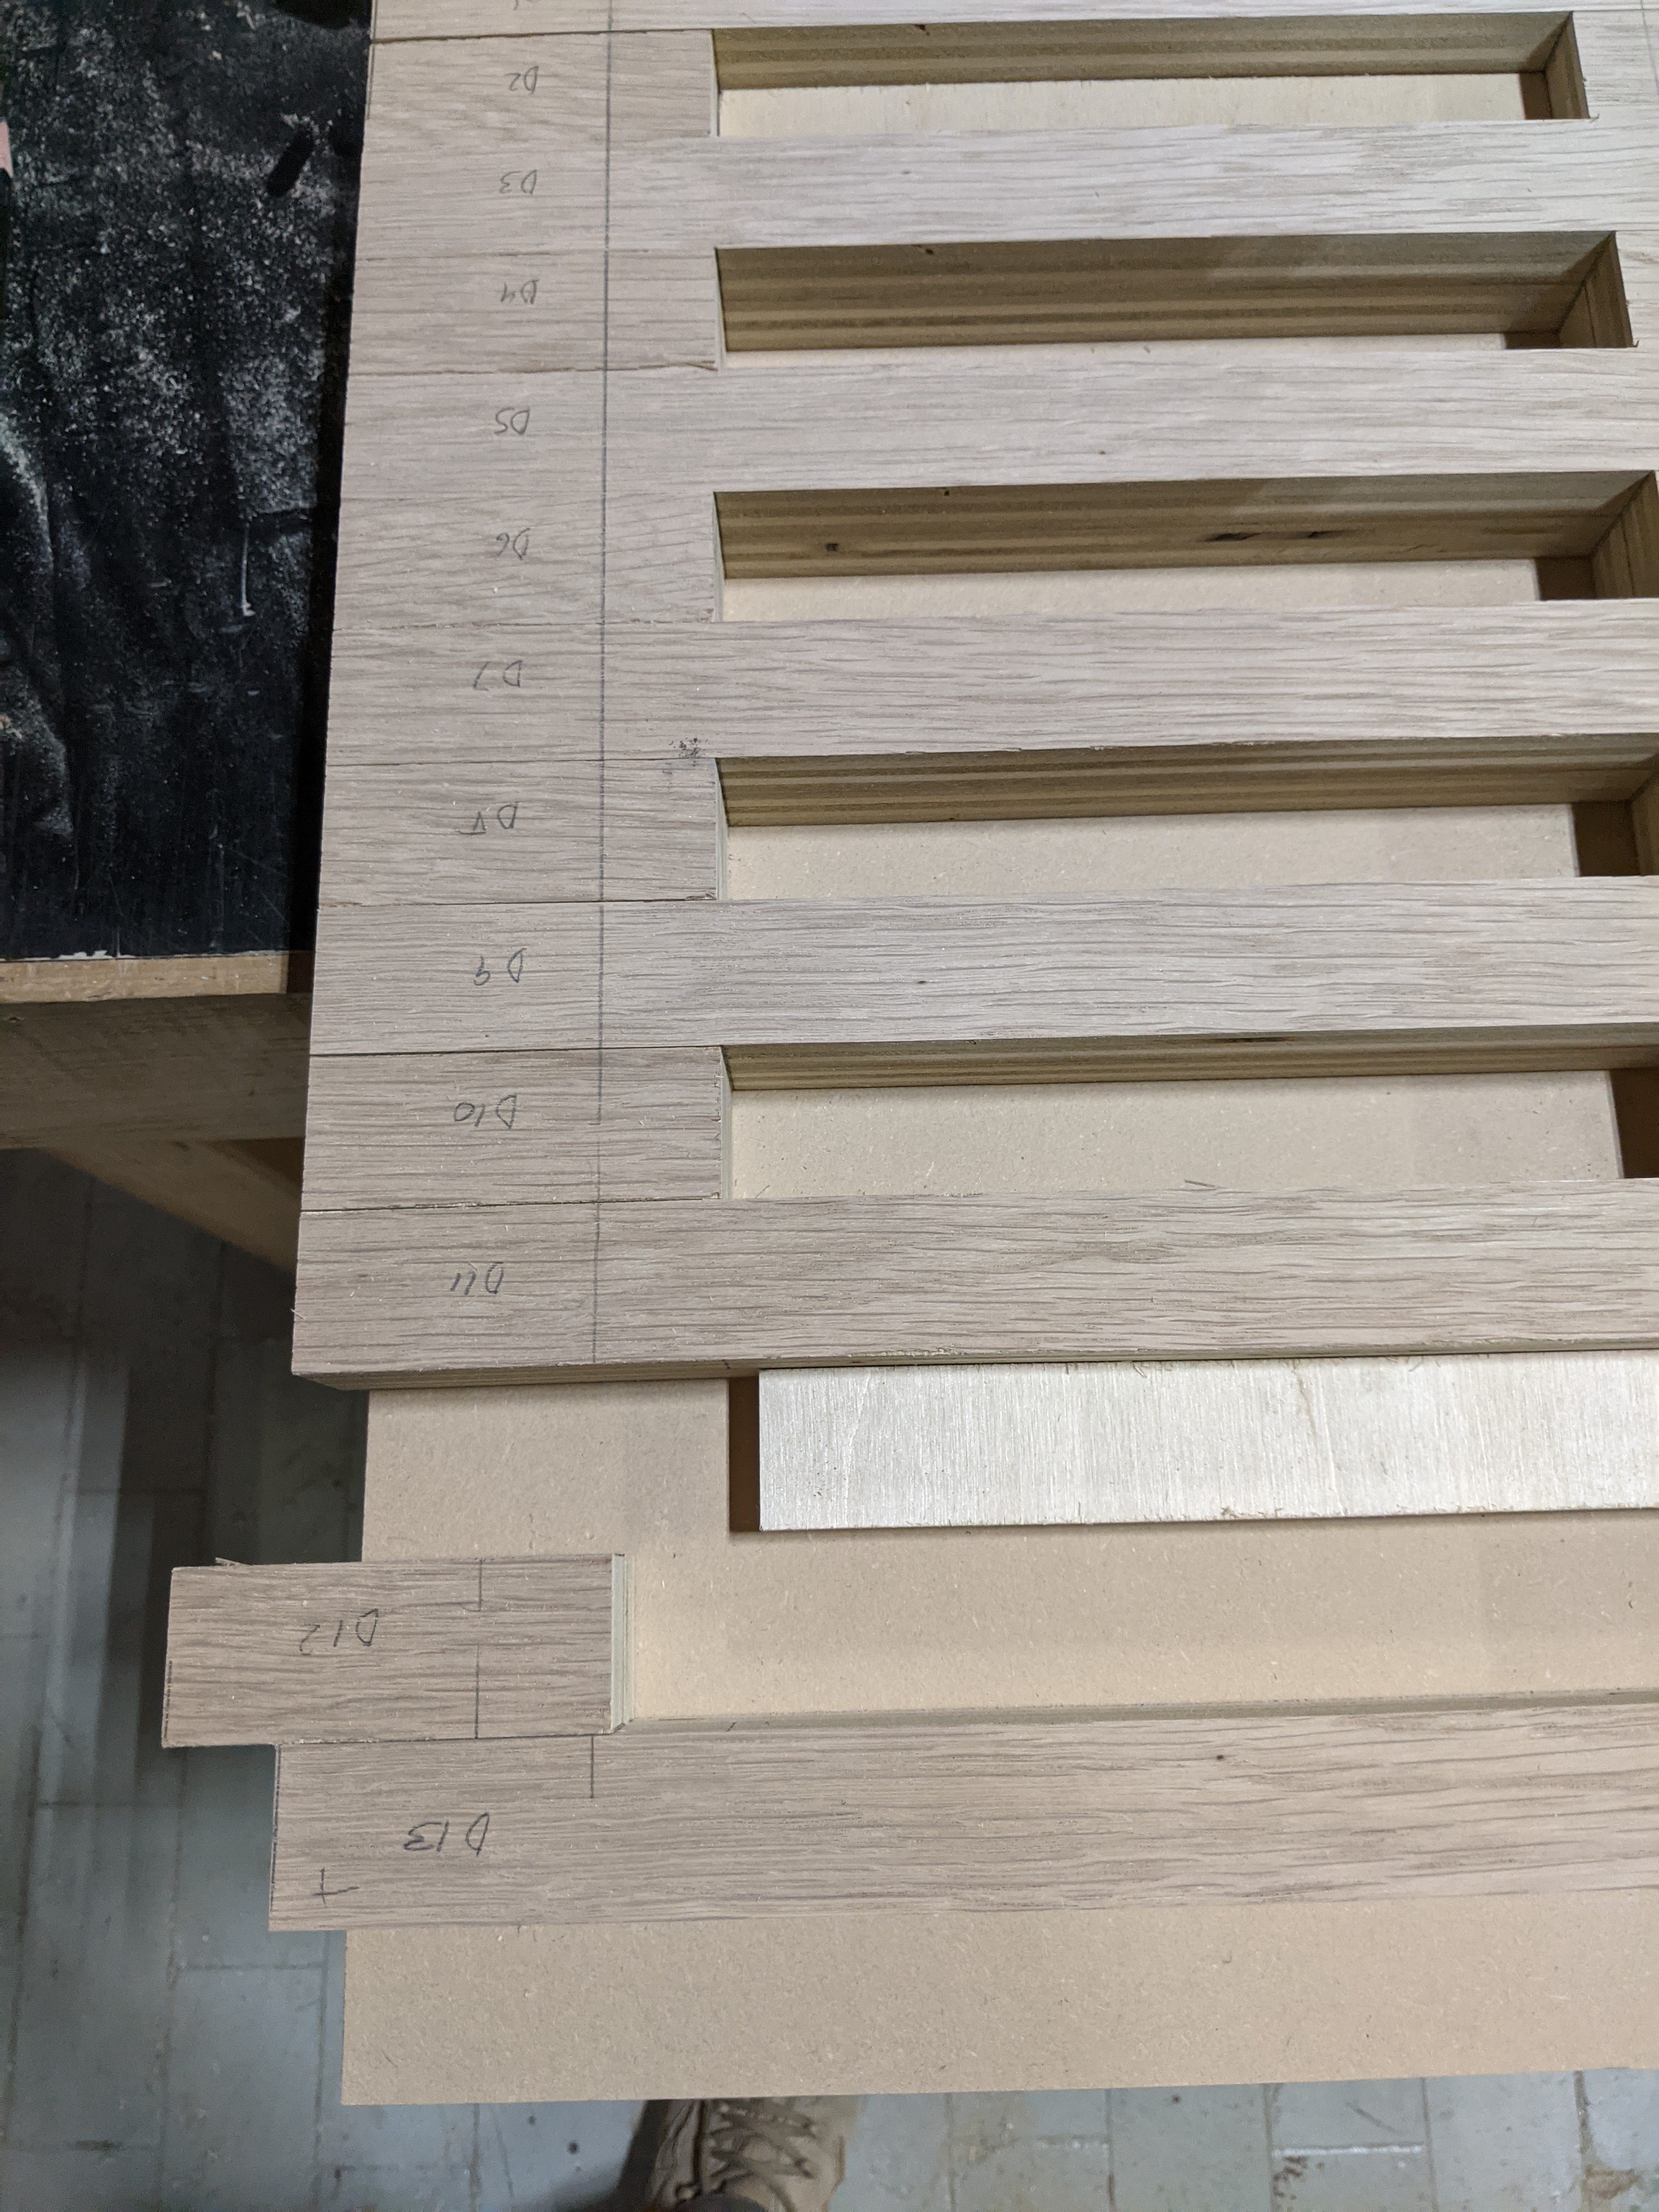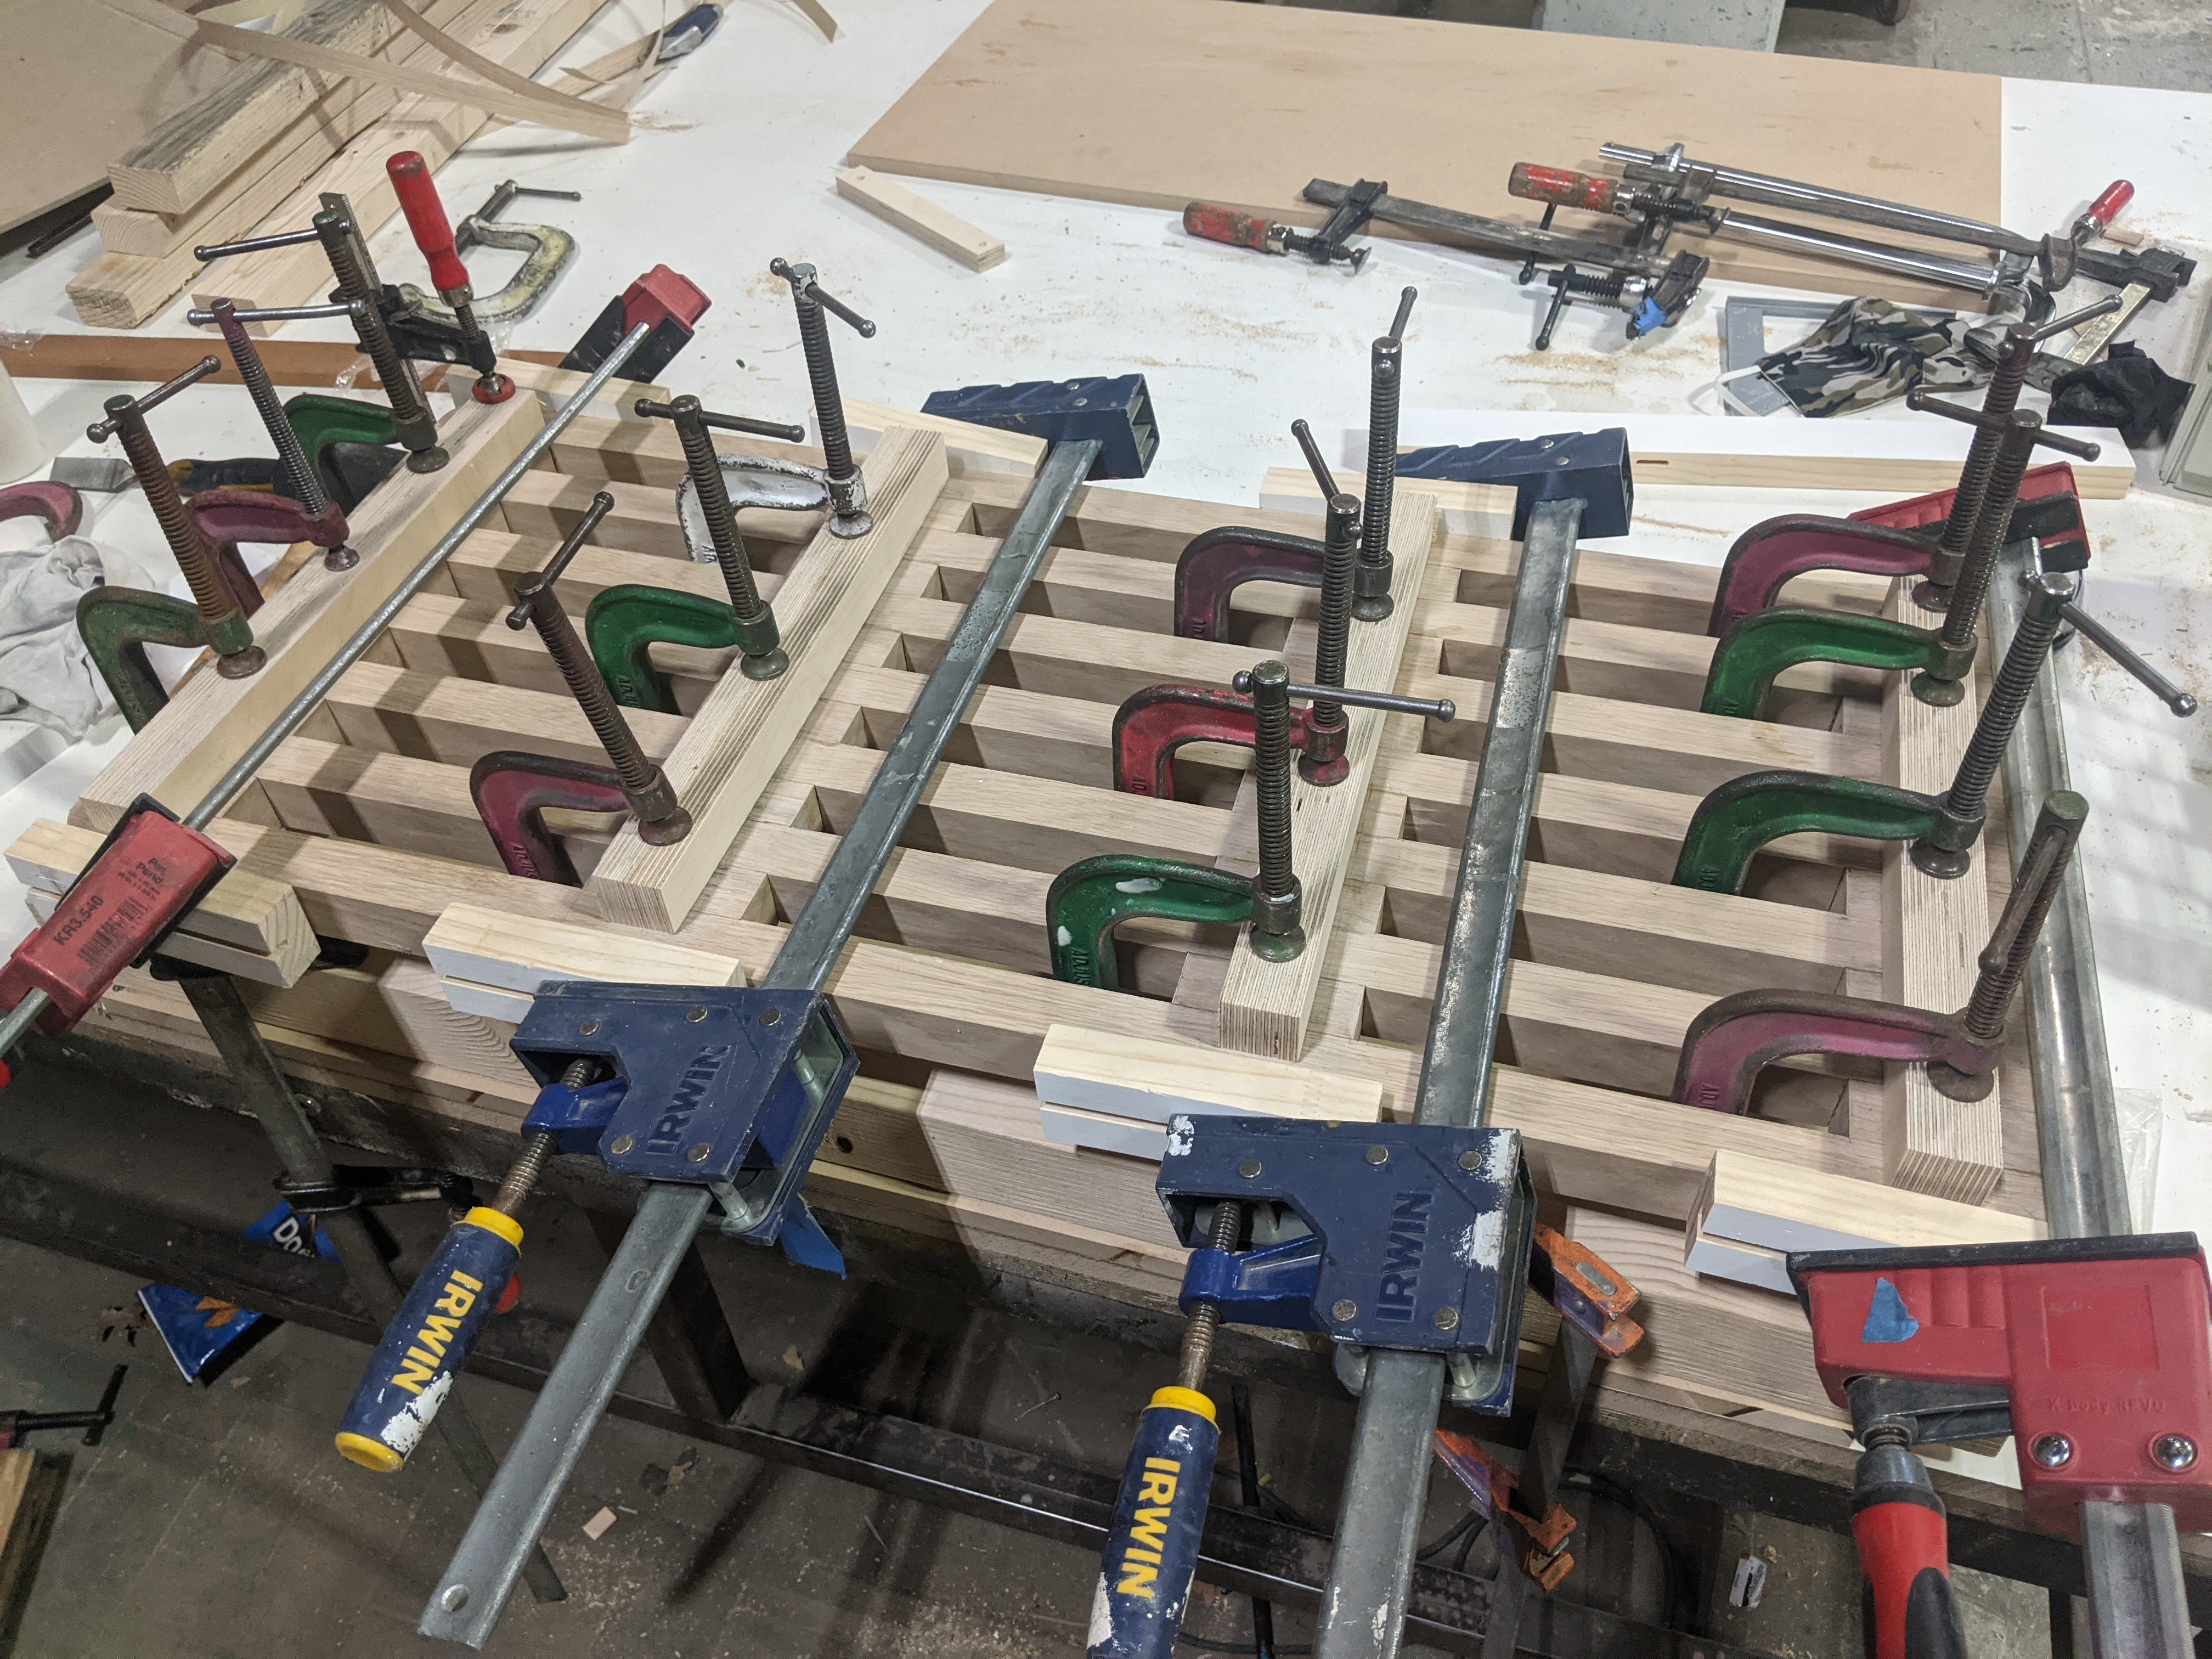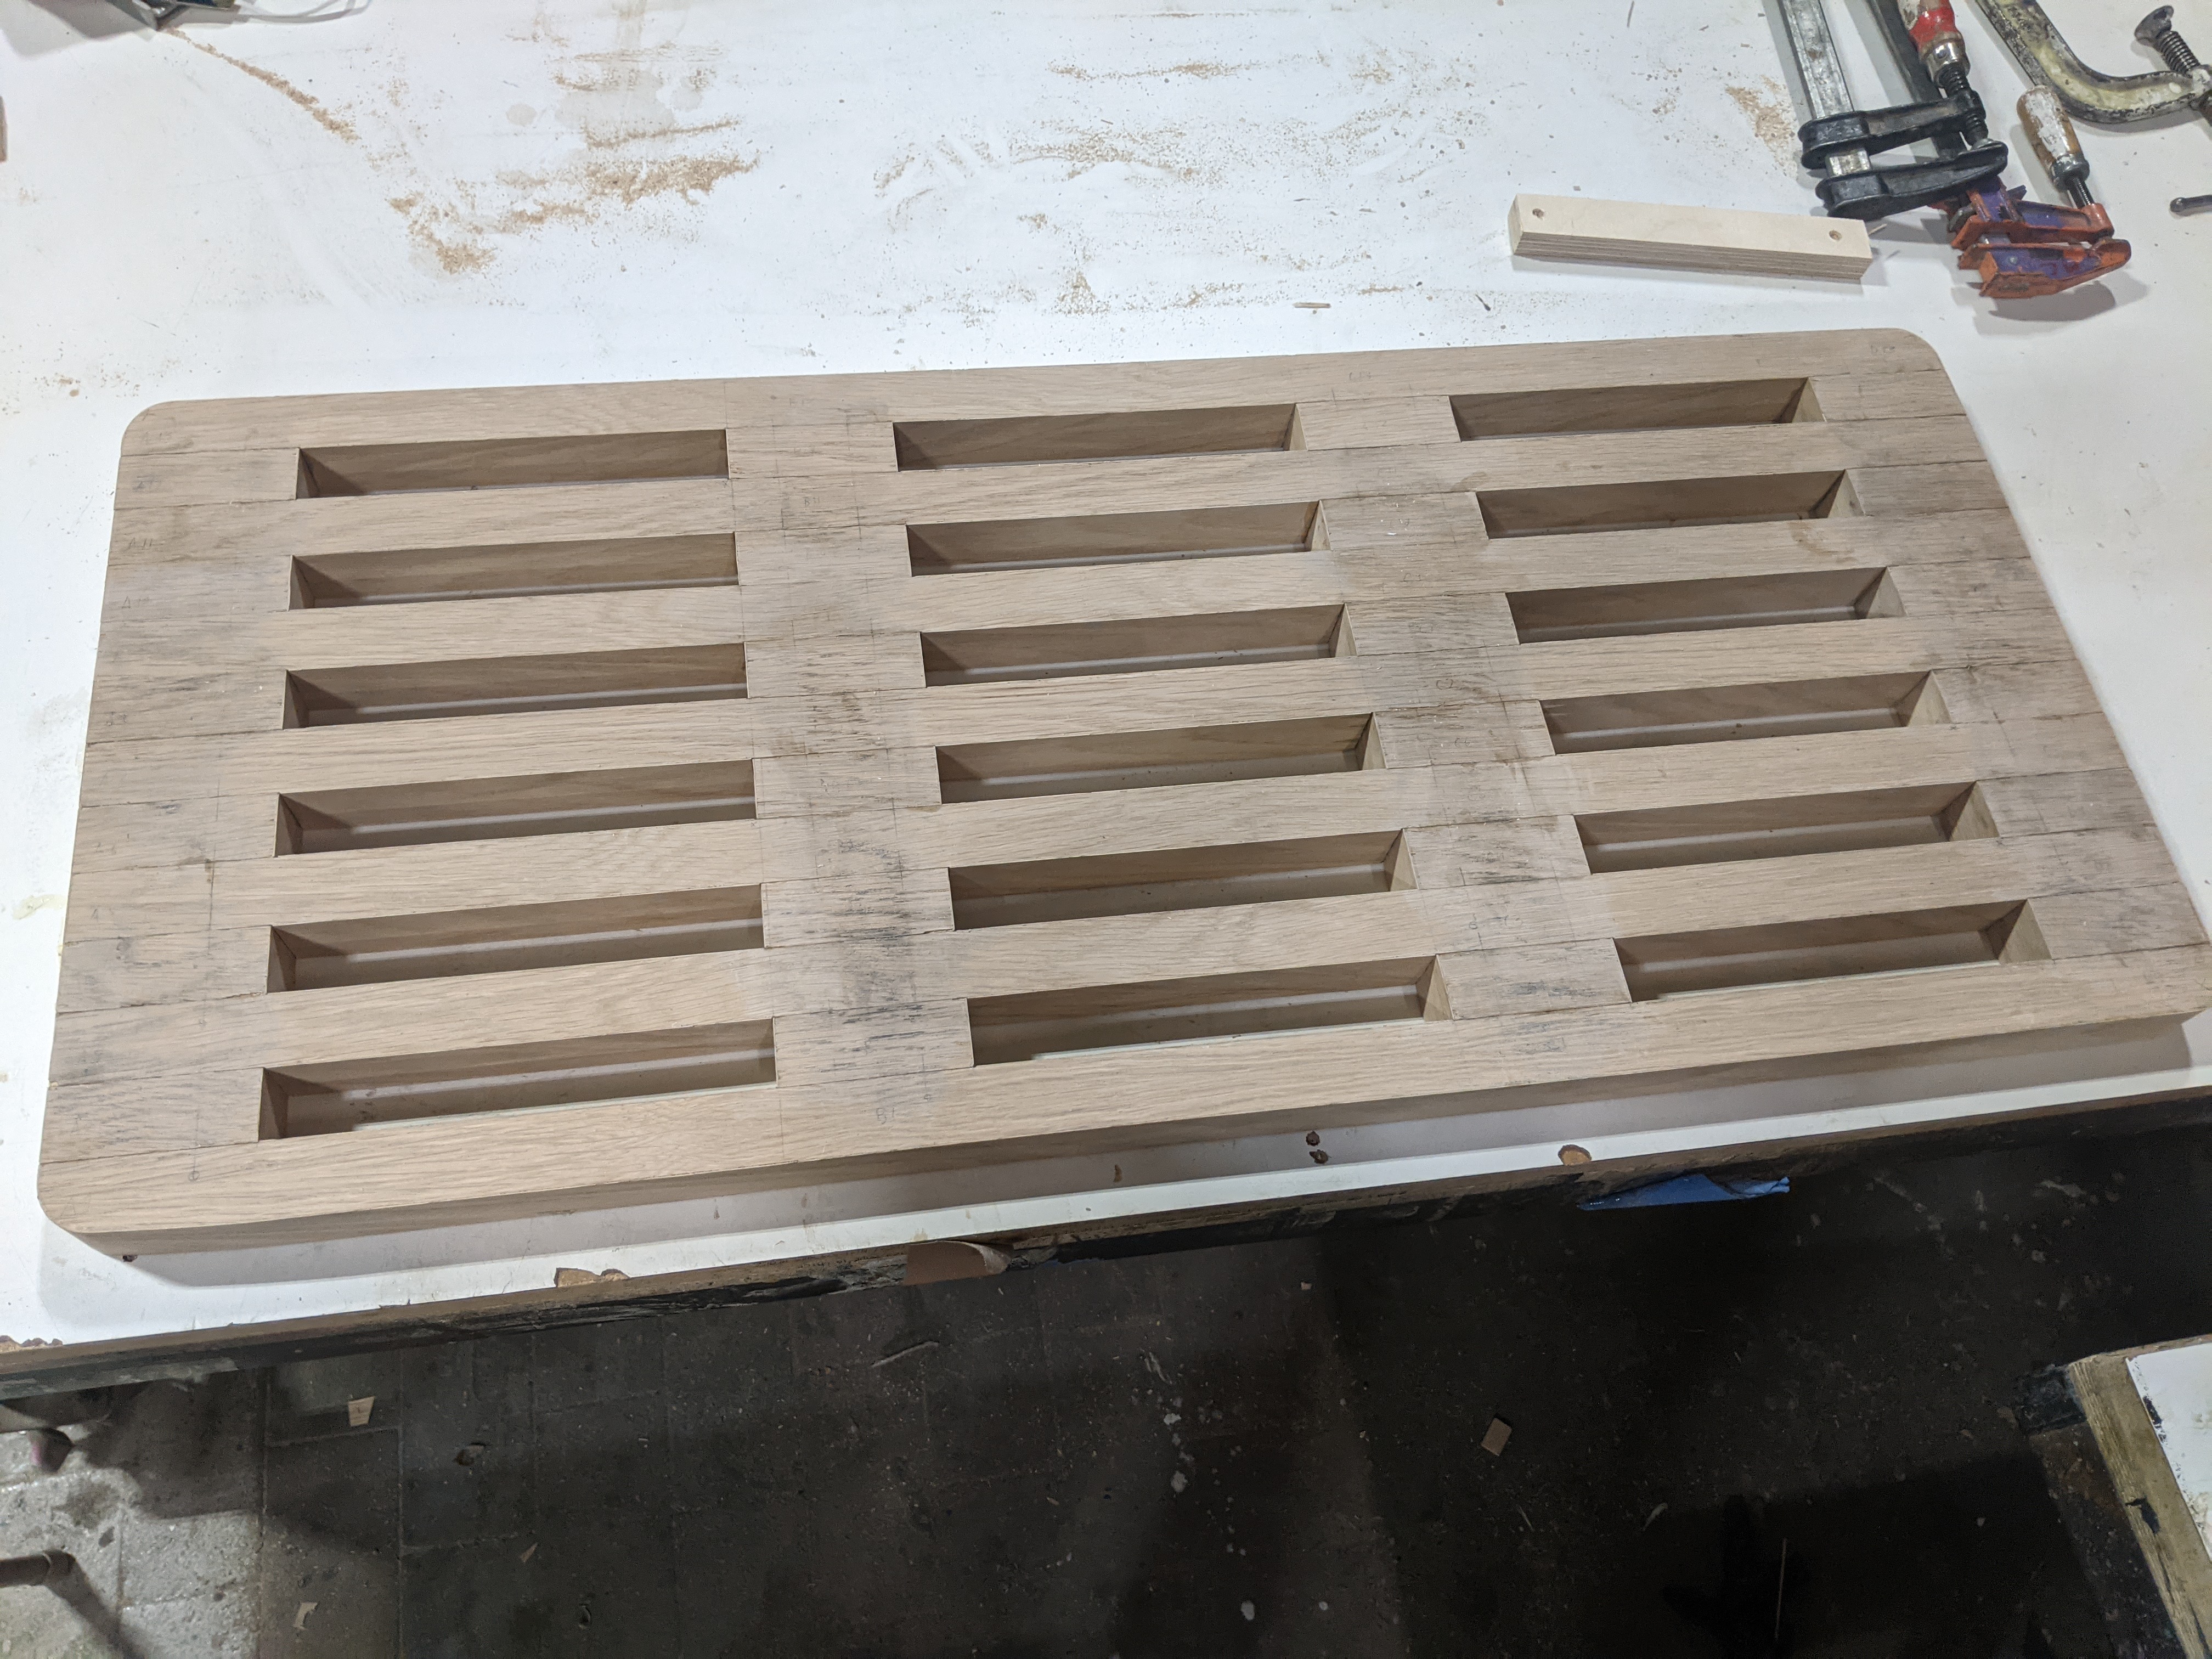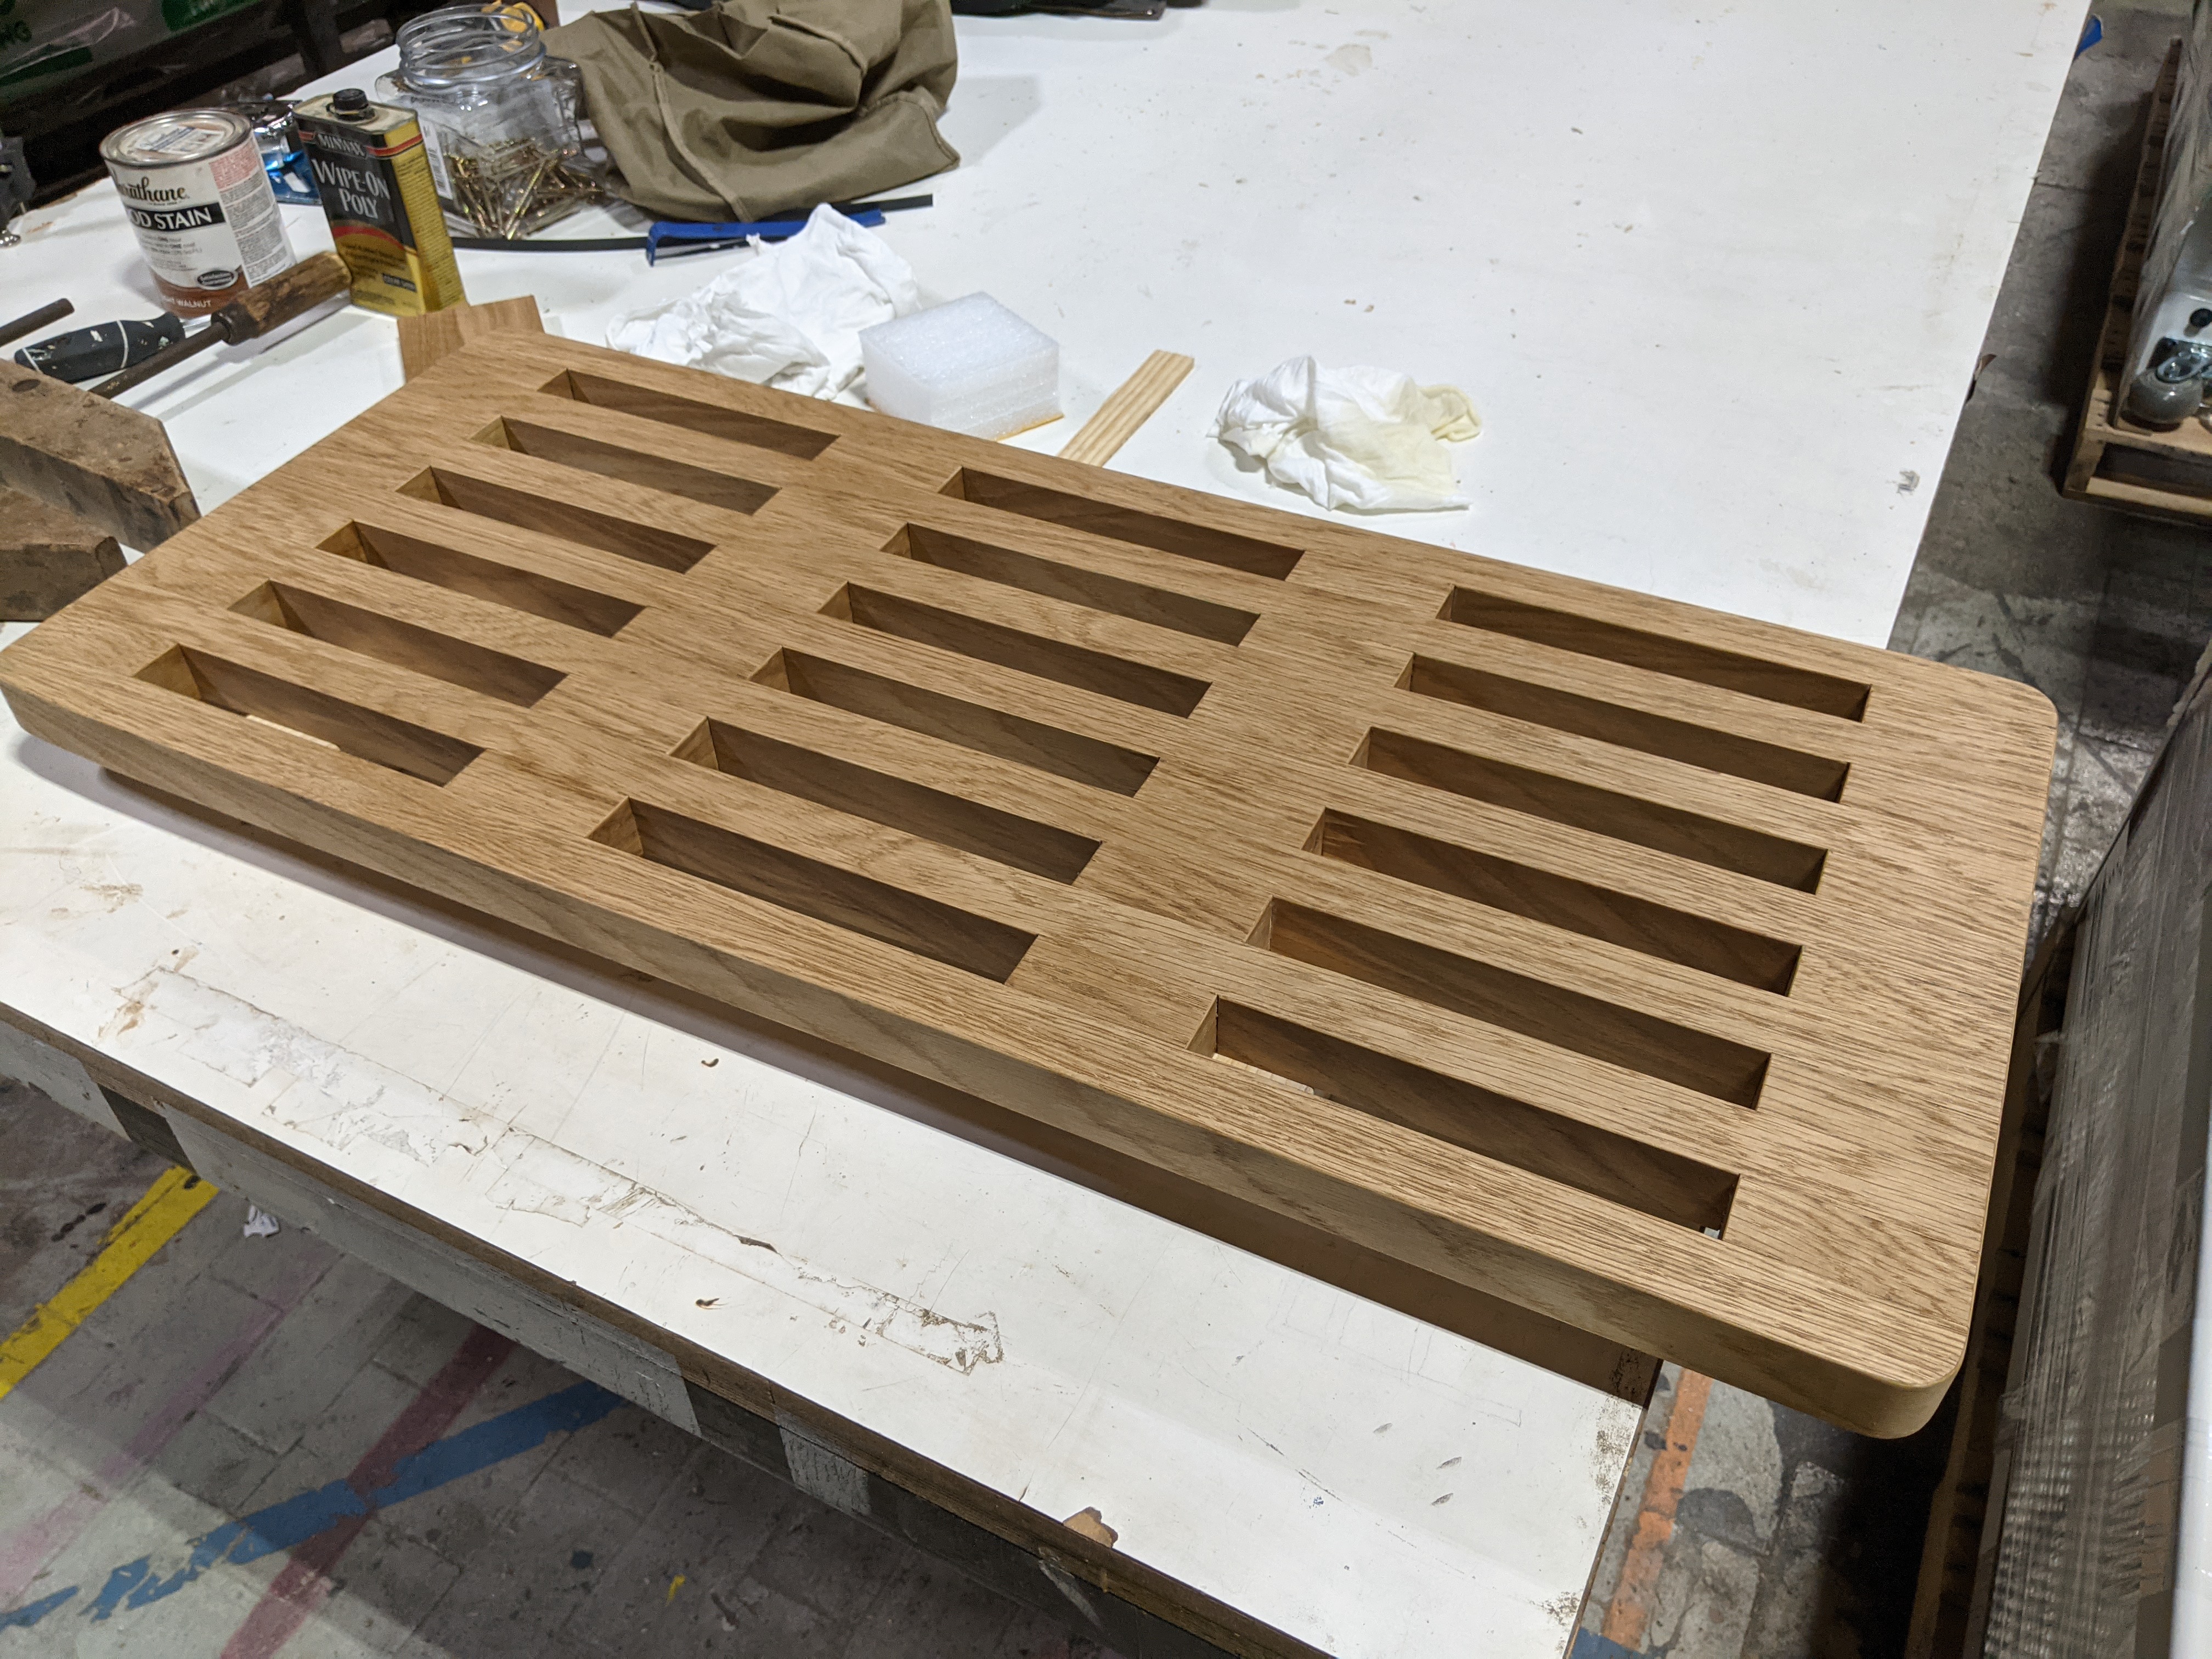
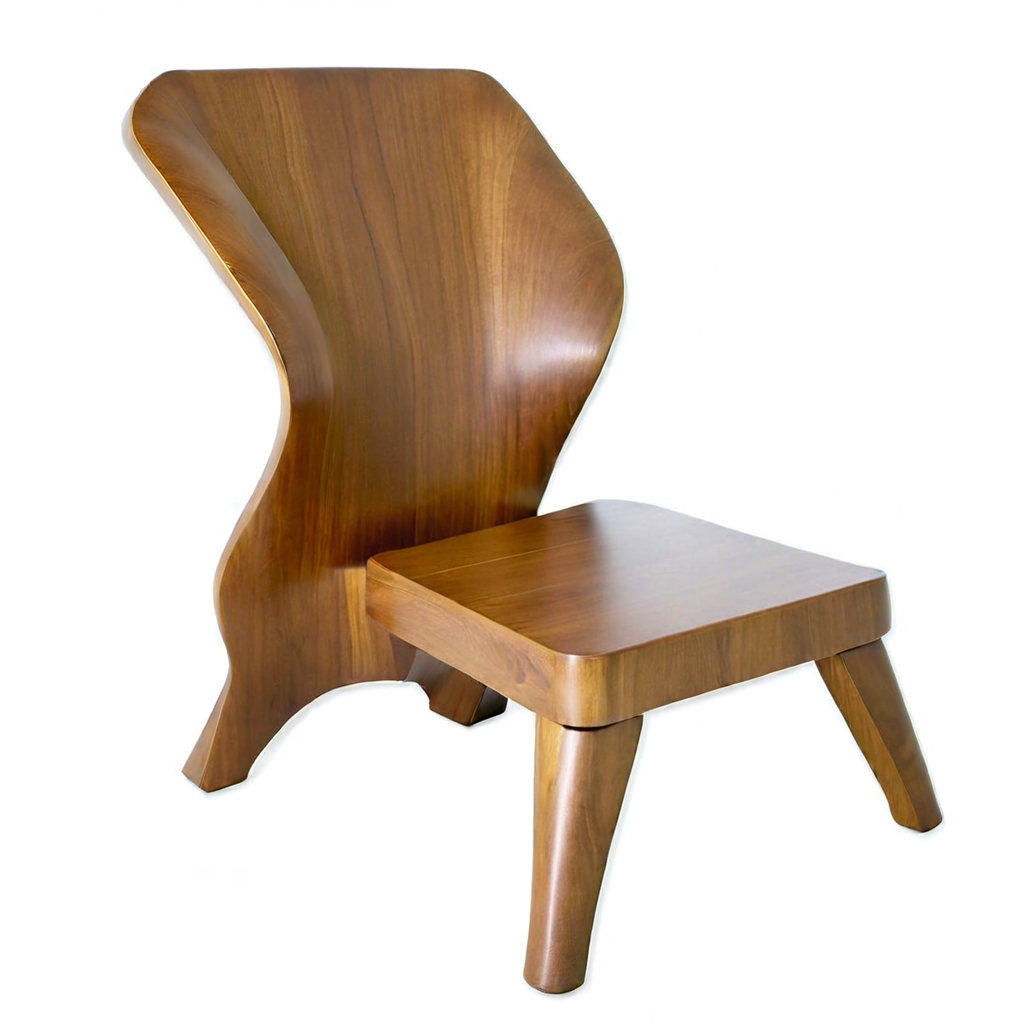
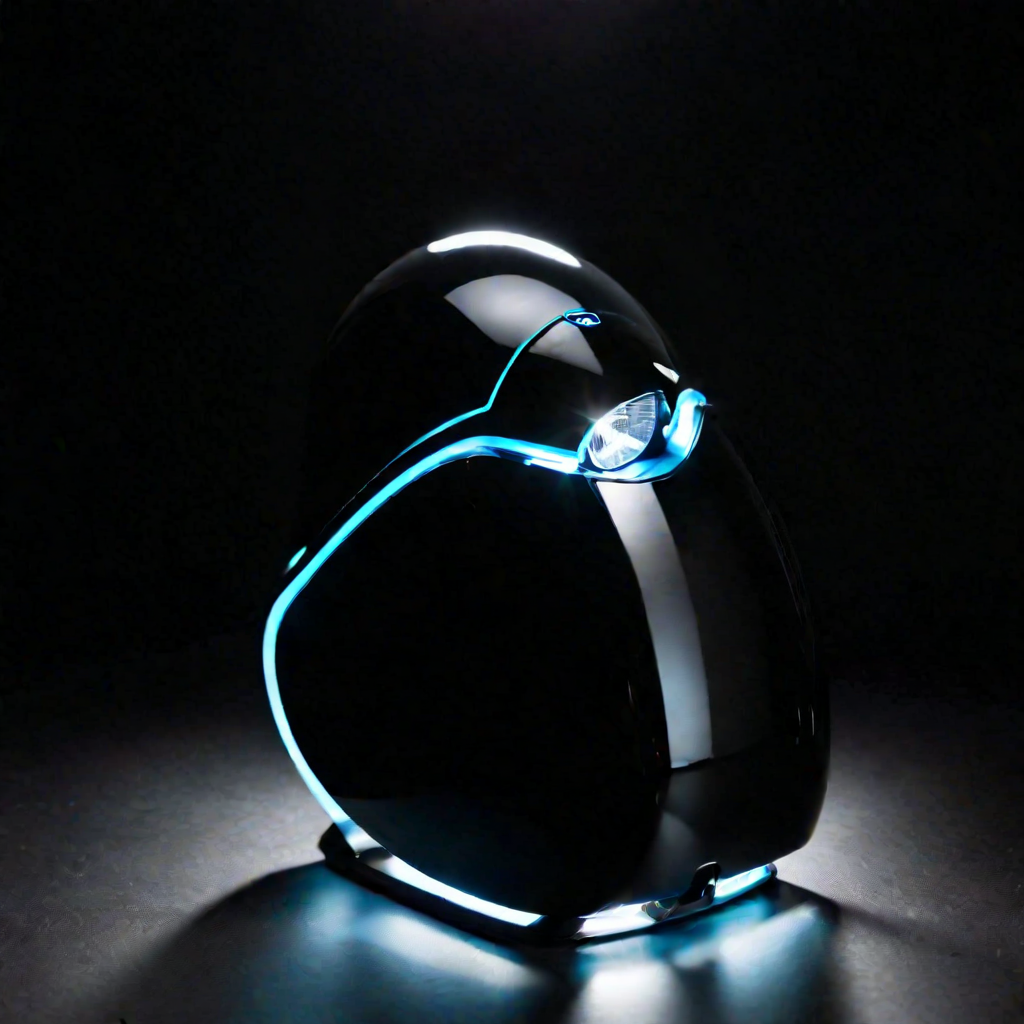
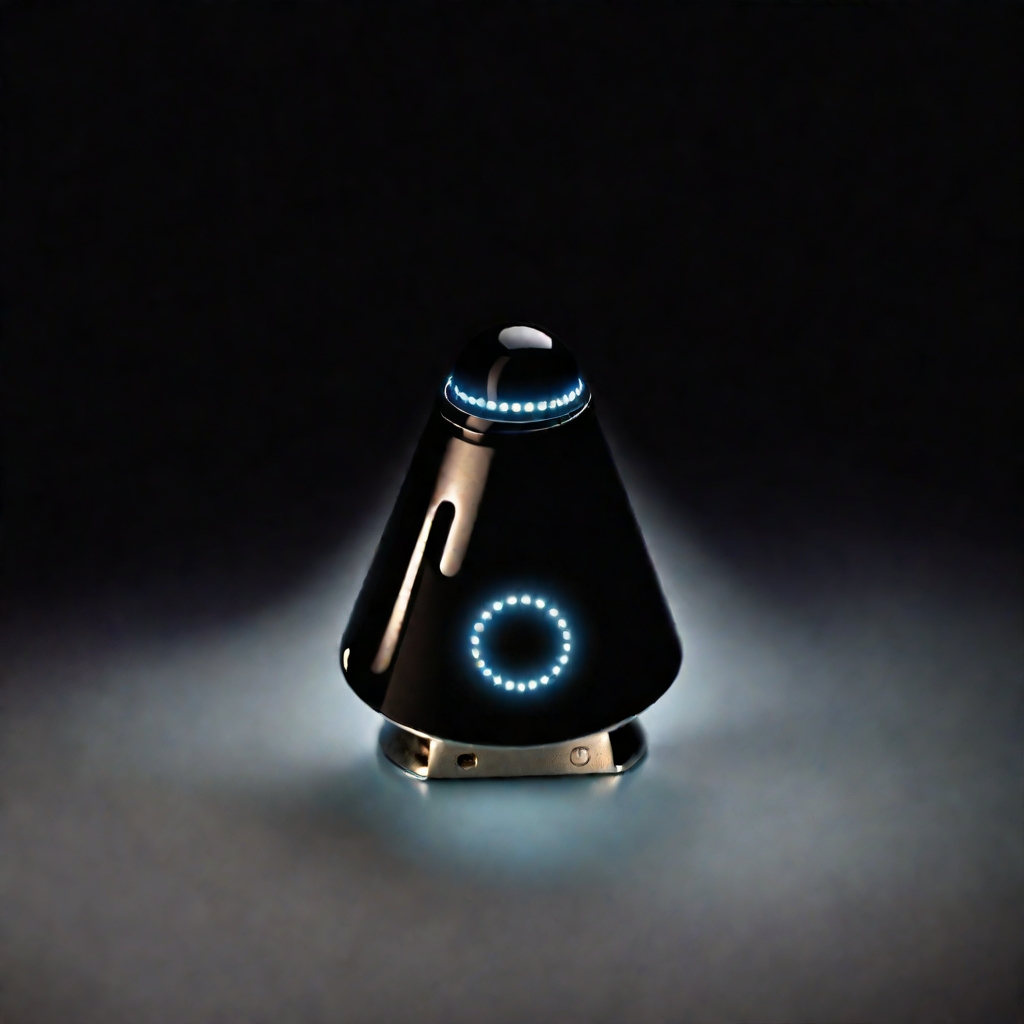
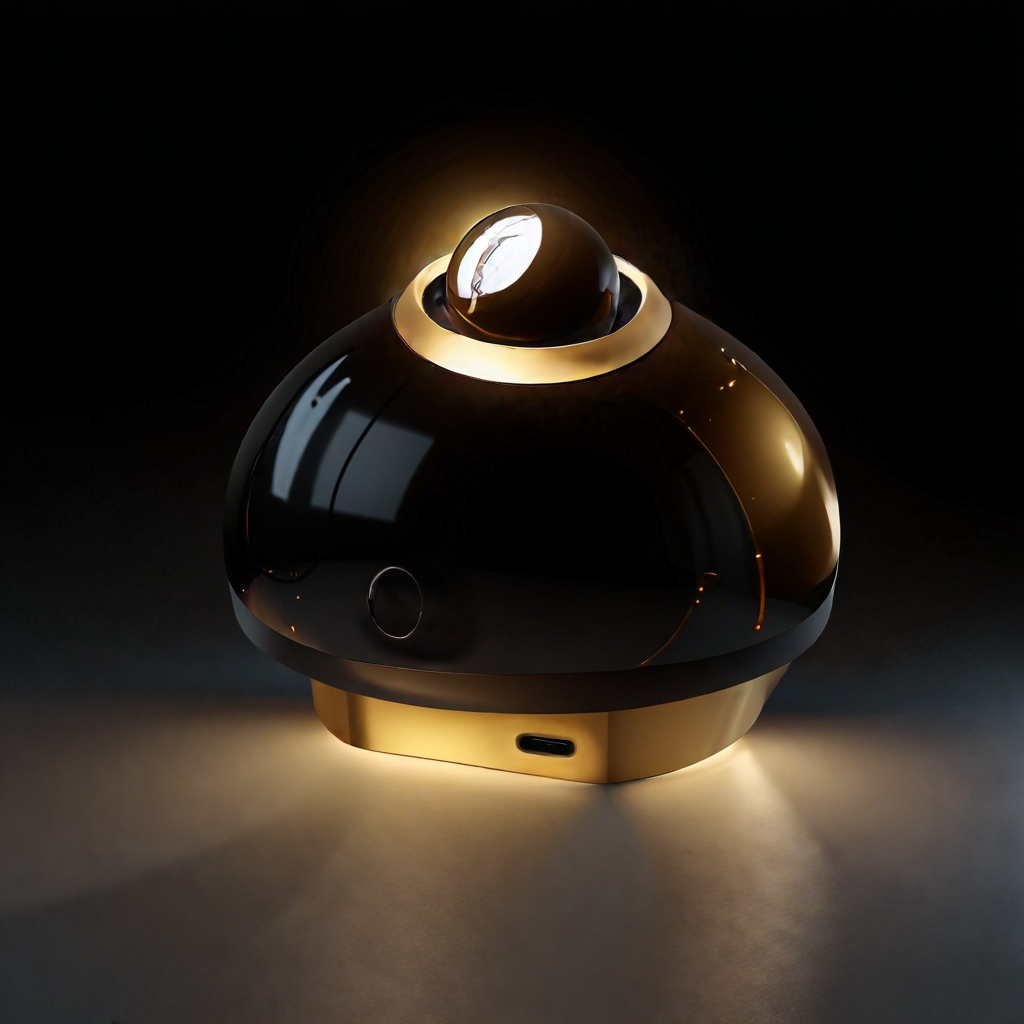


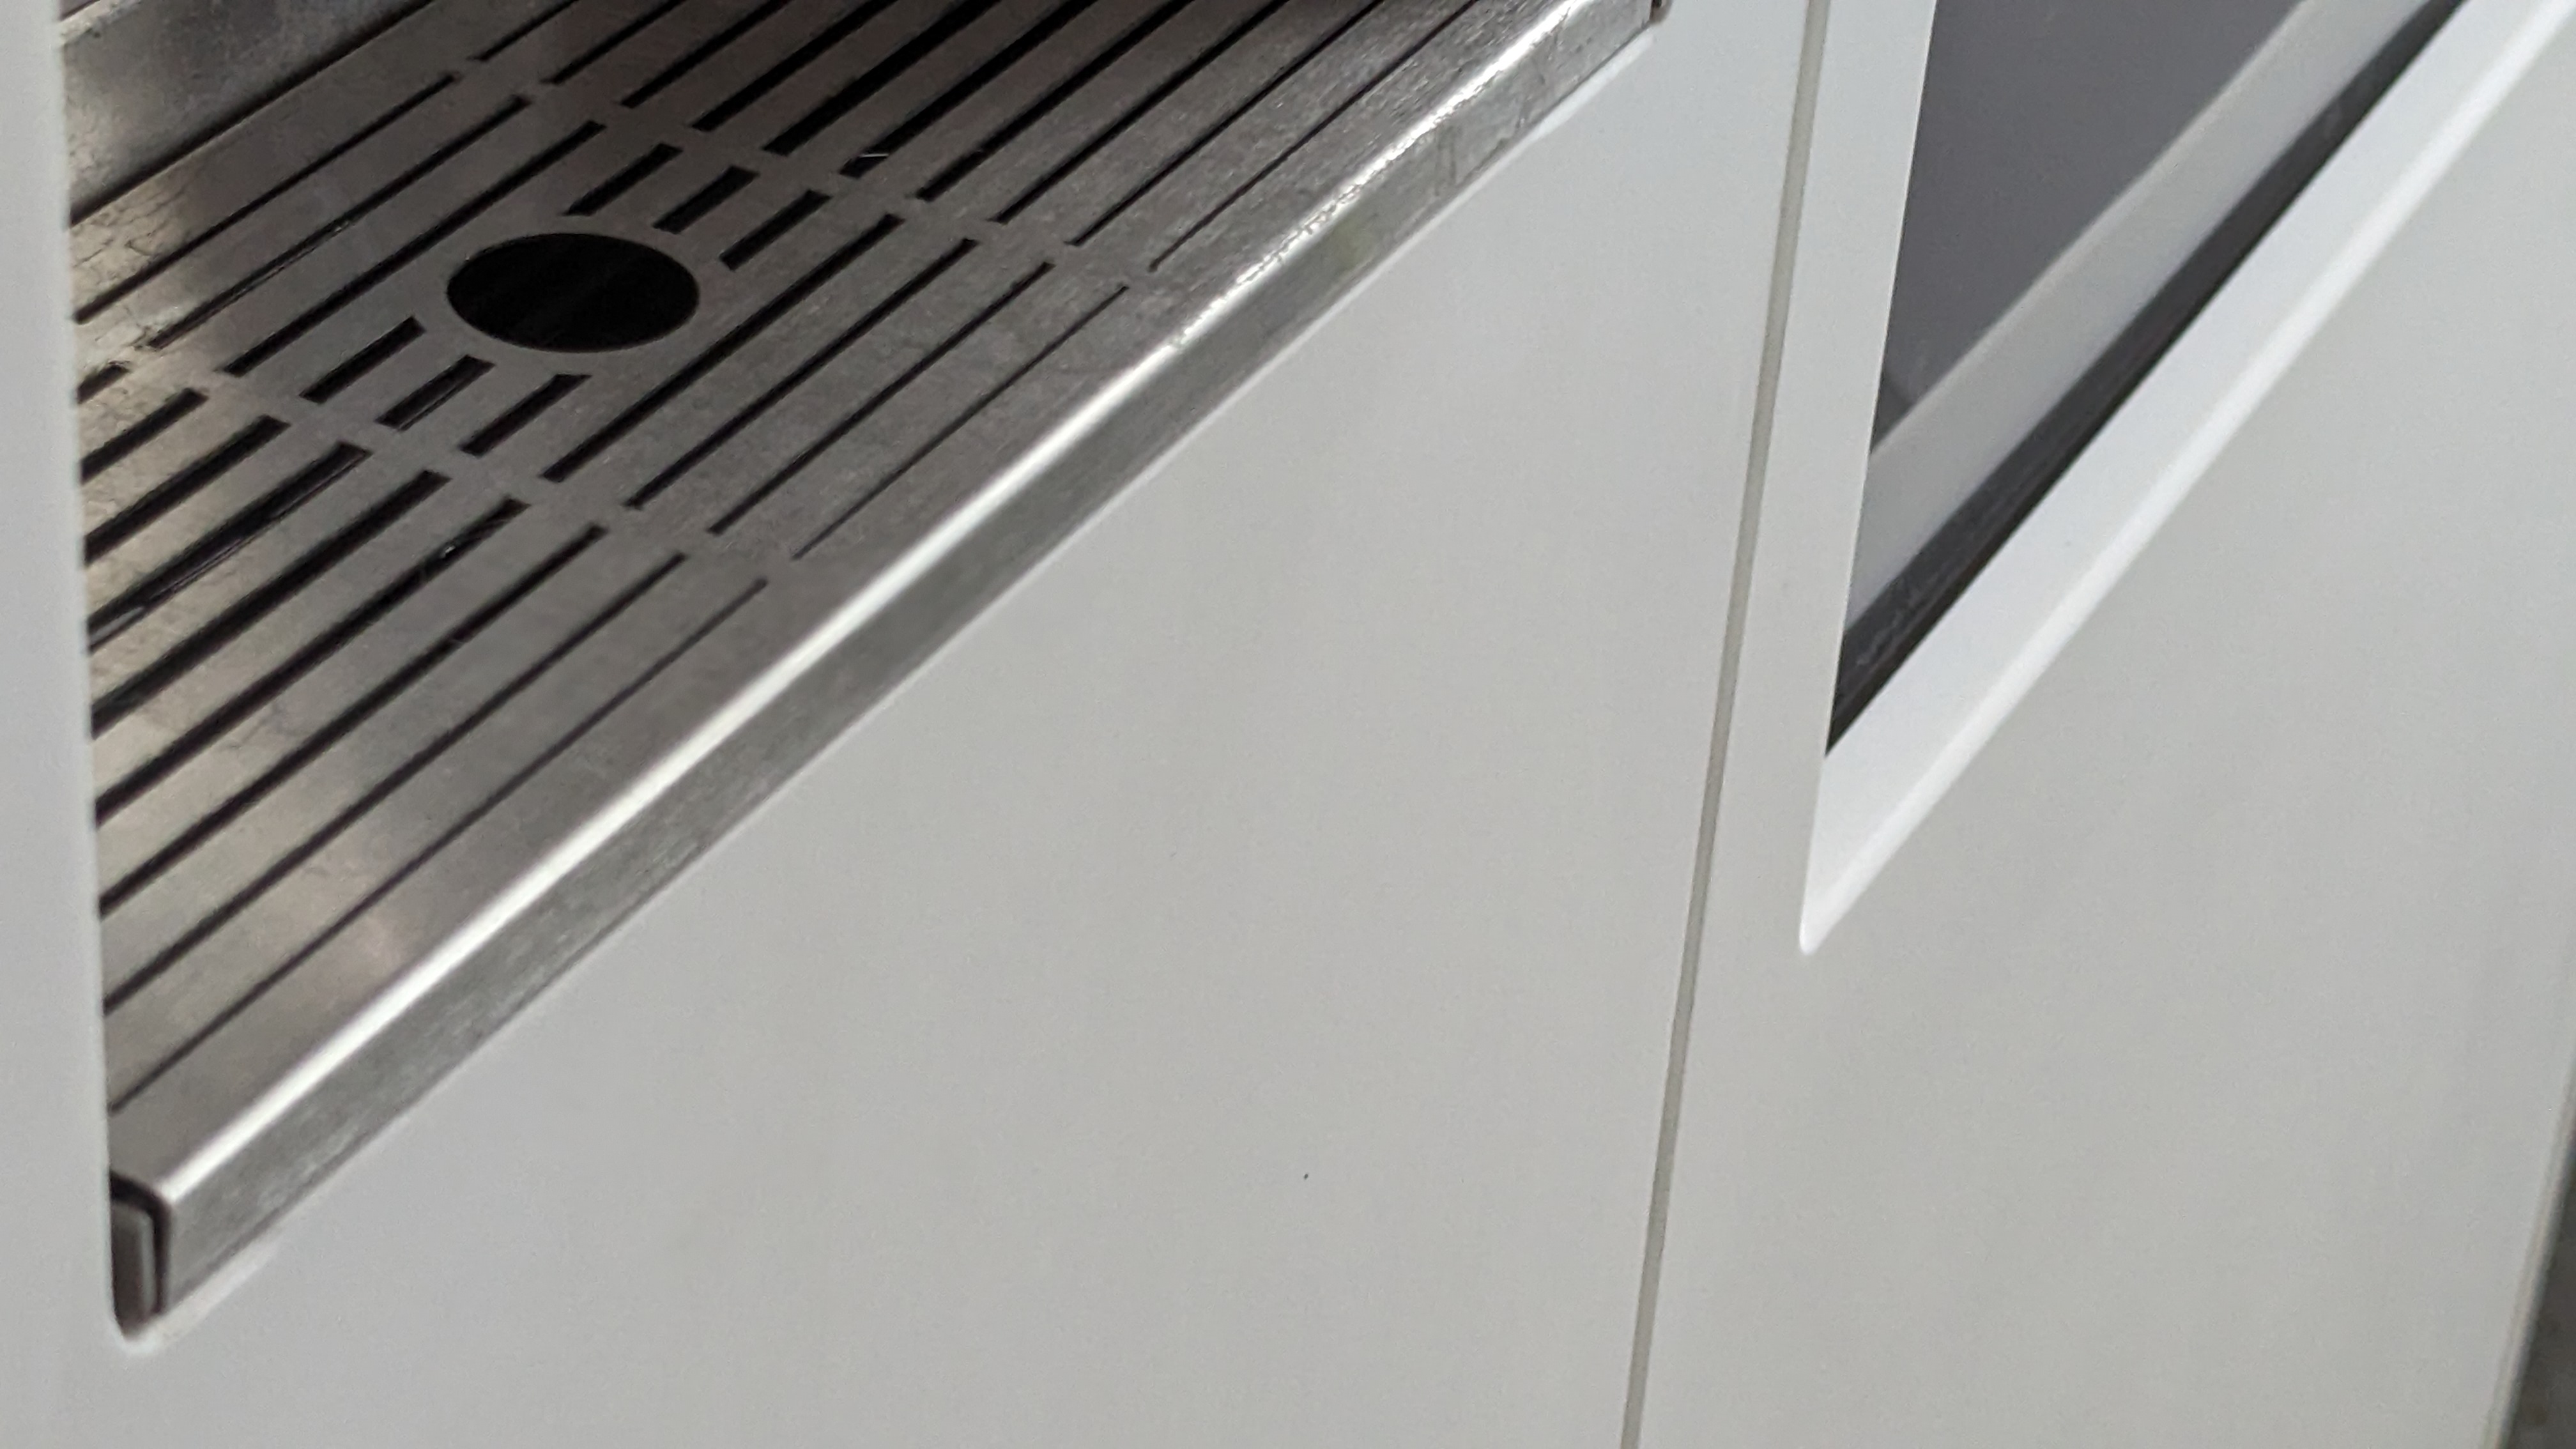
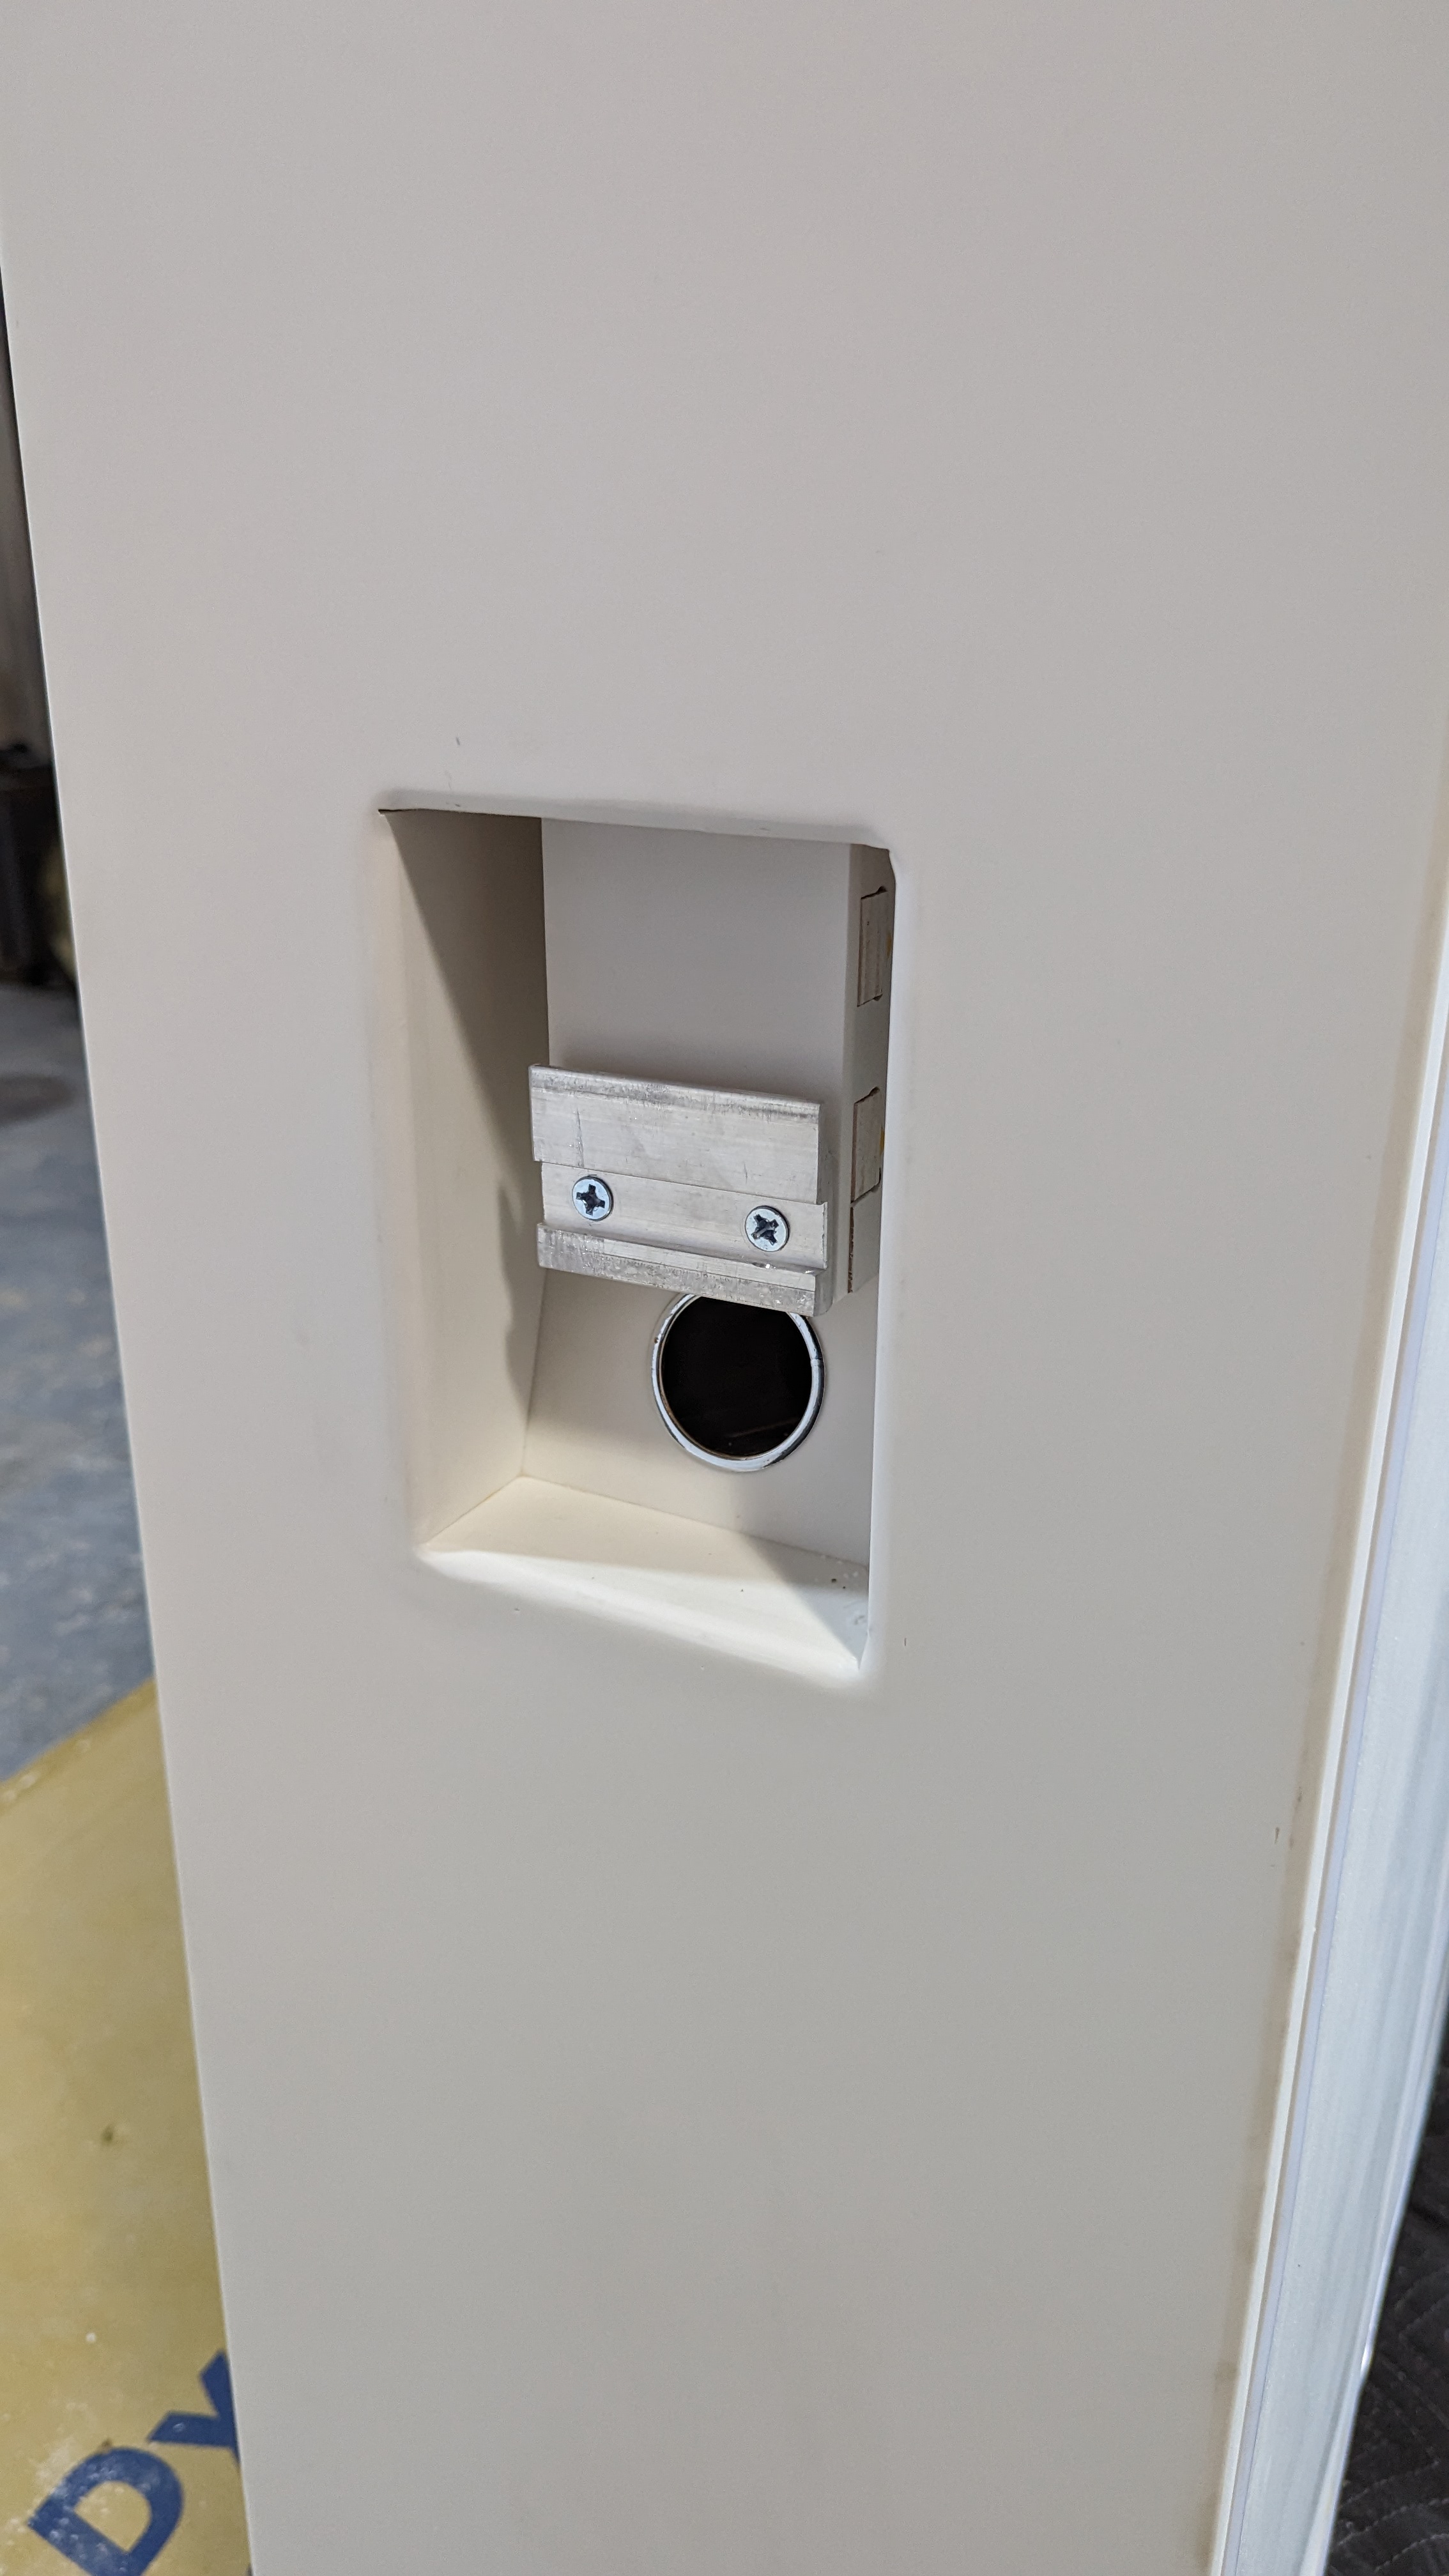
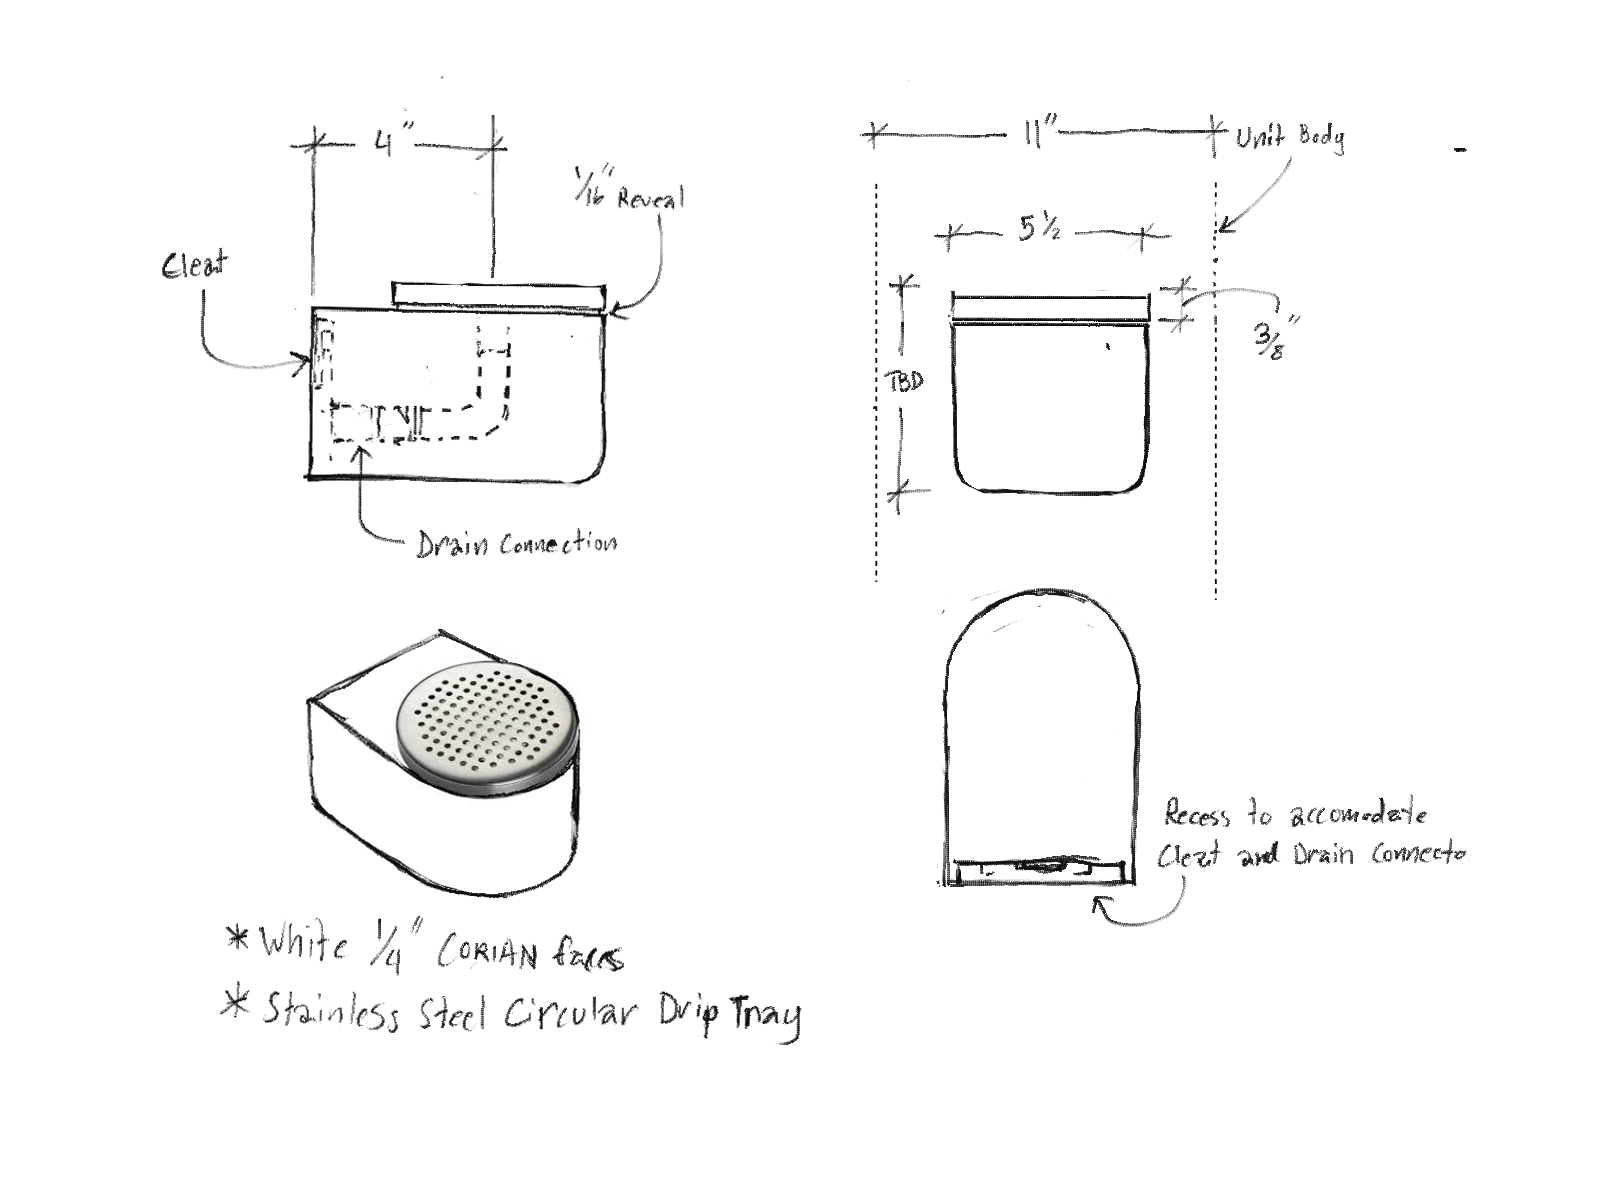
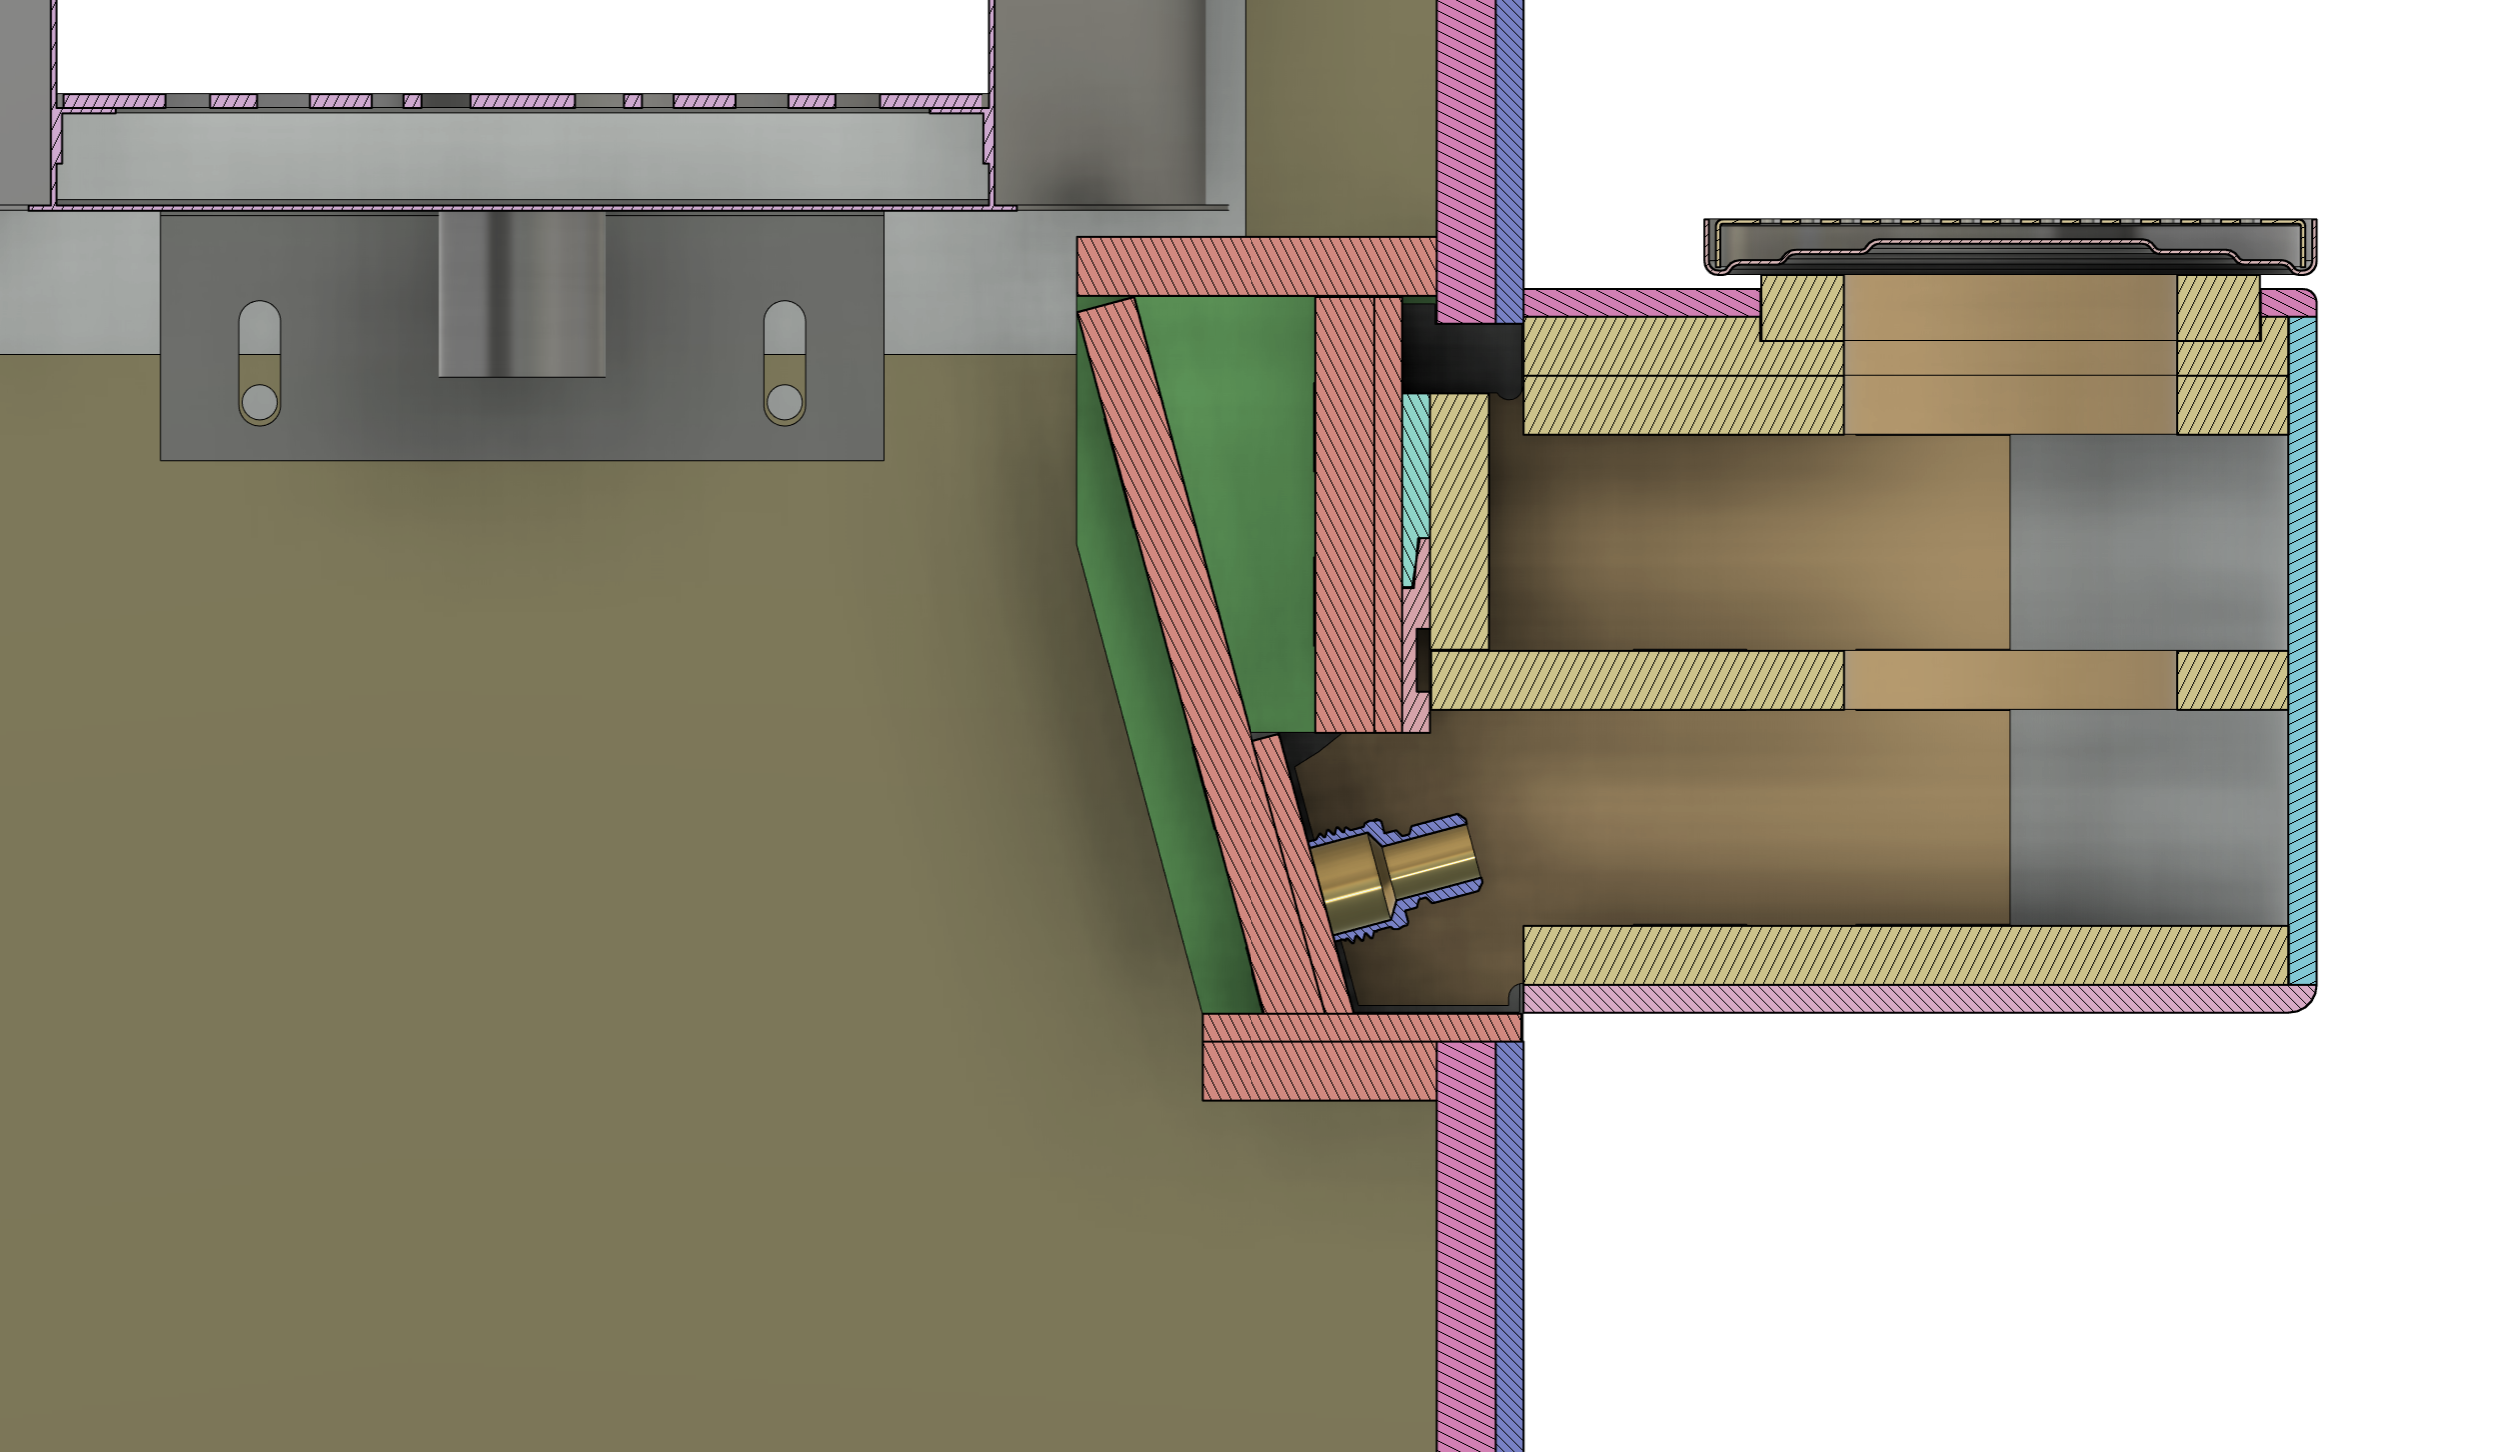
I helped design, prototype and iterate on a product being developed by a startup water fountain company.
This project allowed me to exercise my whole range of fabrication/images experience and skills. This included CNC work, CAD, Carpentry and Project Management.


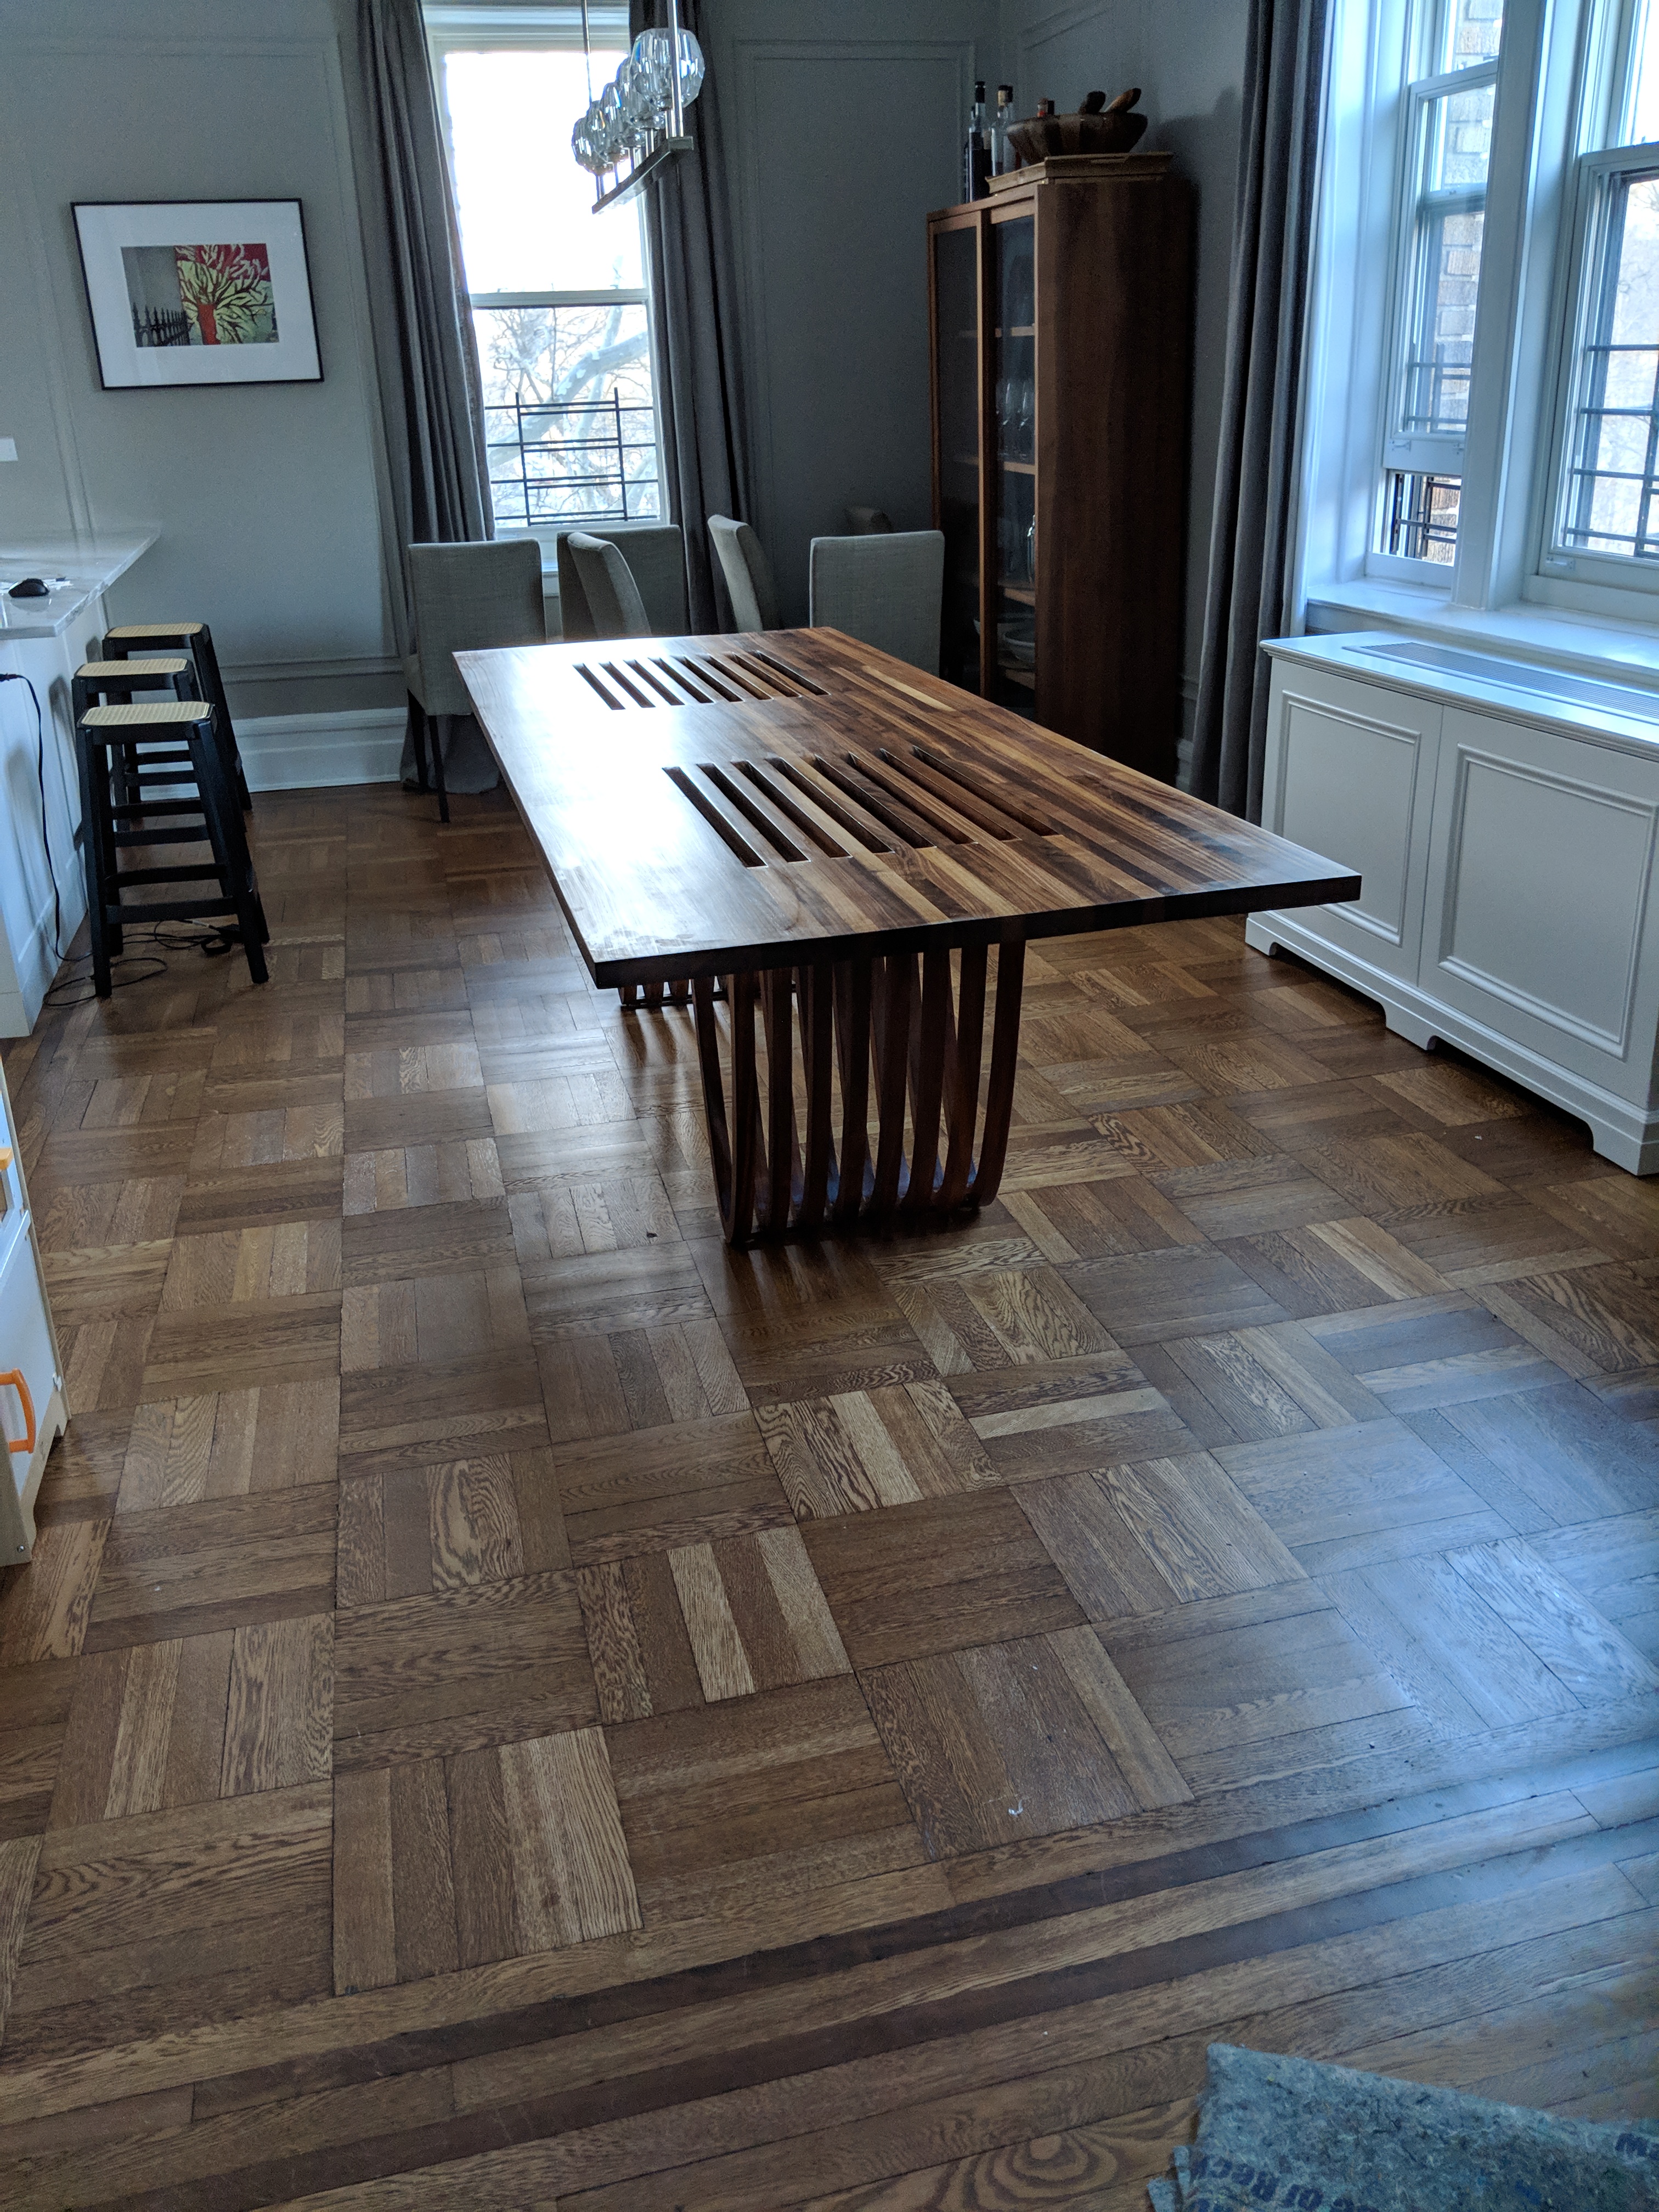
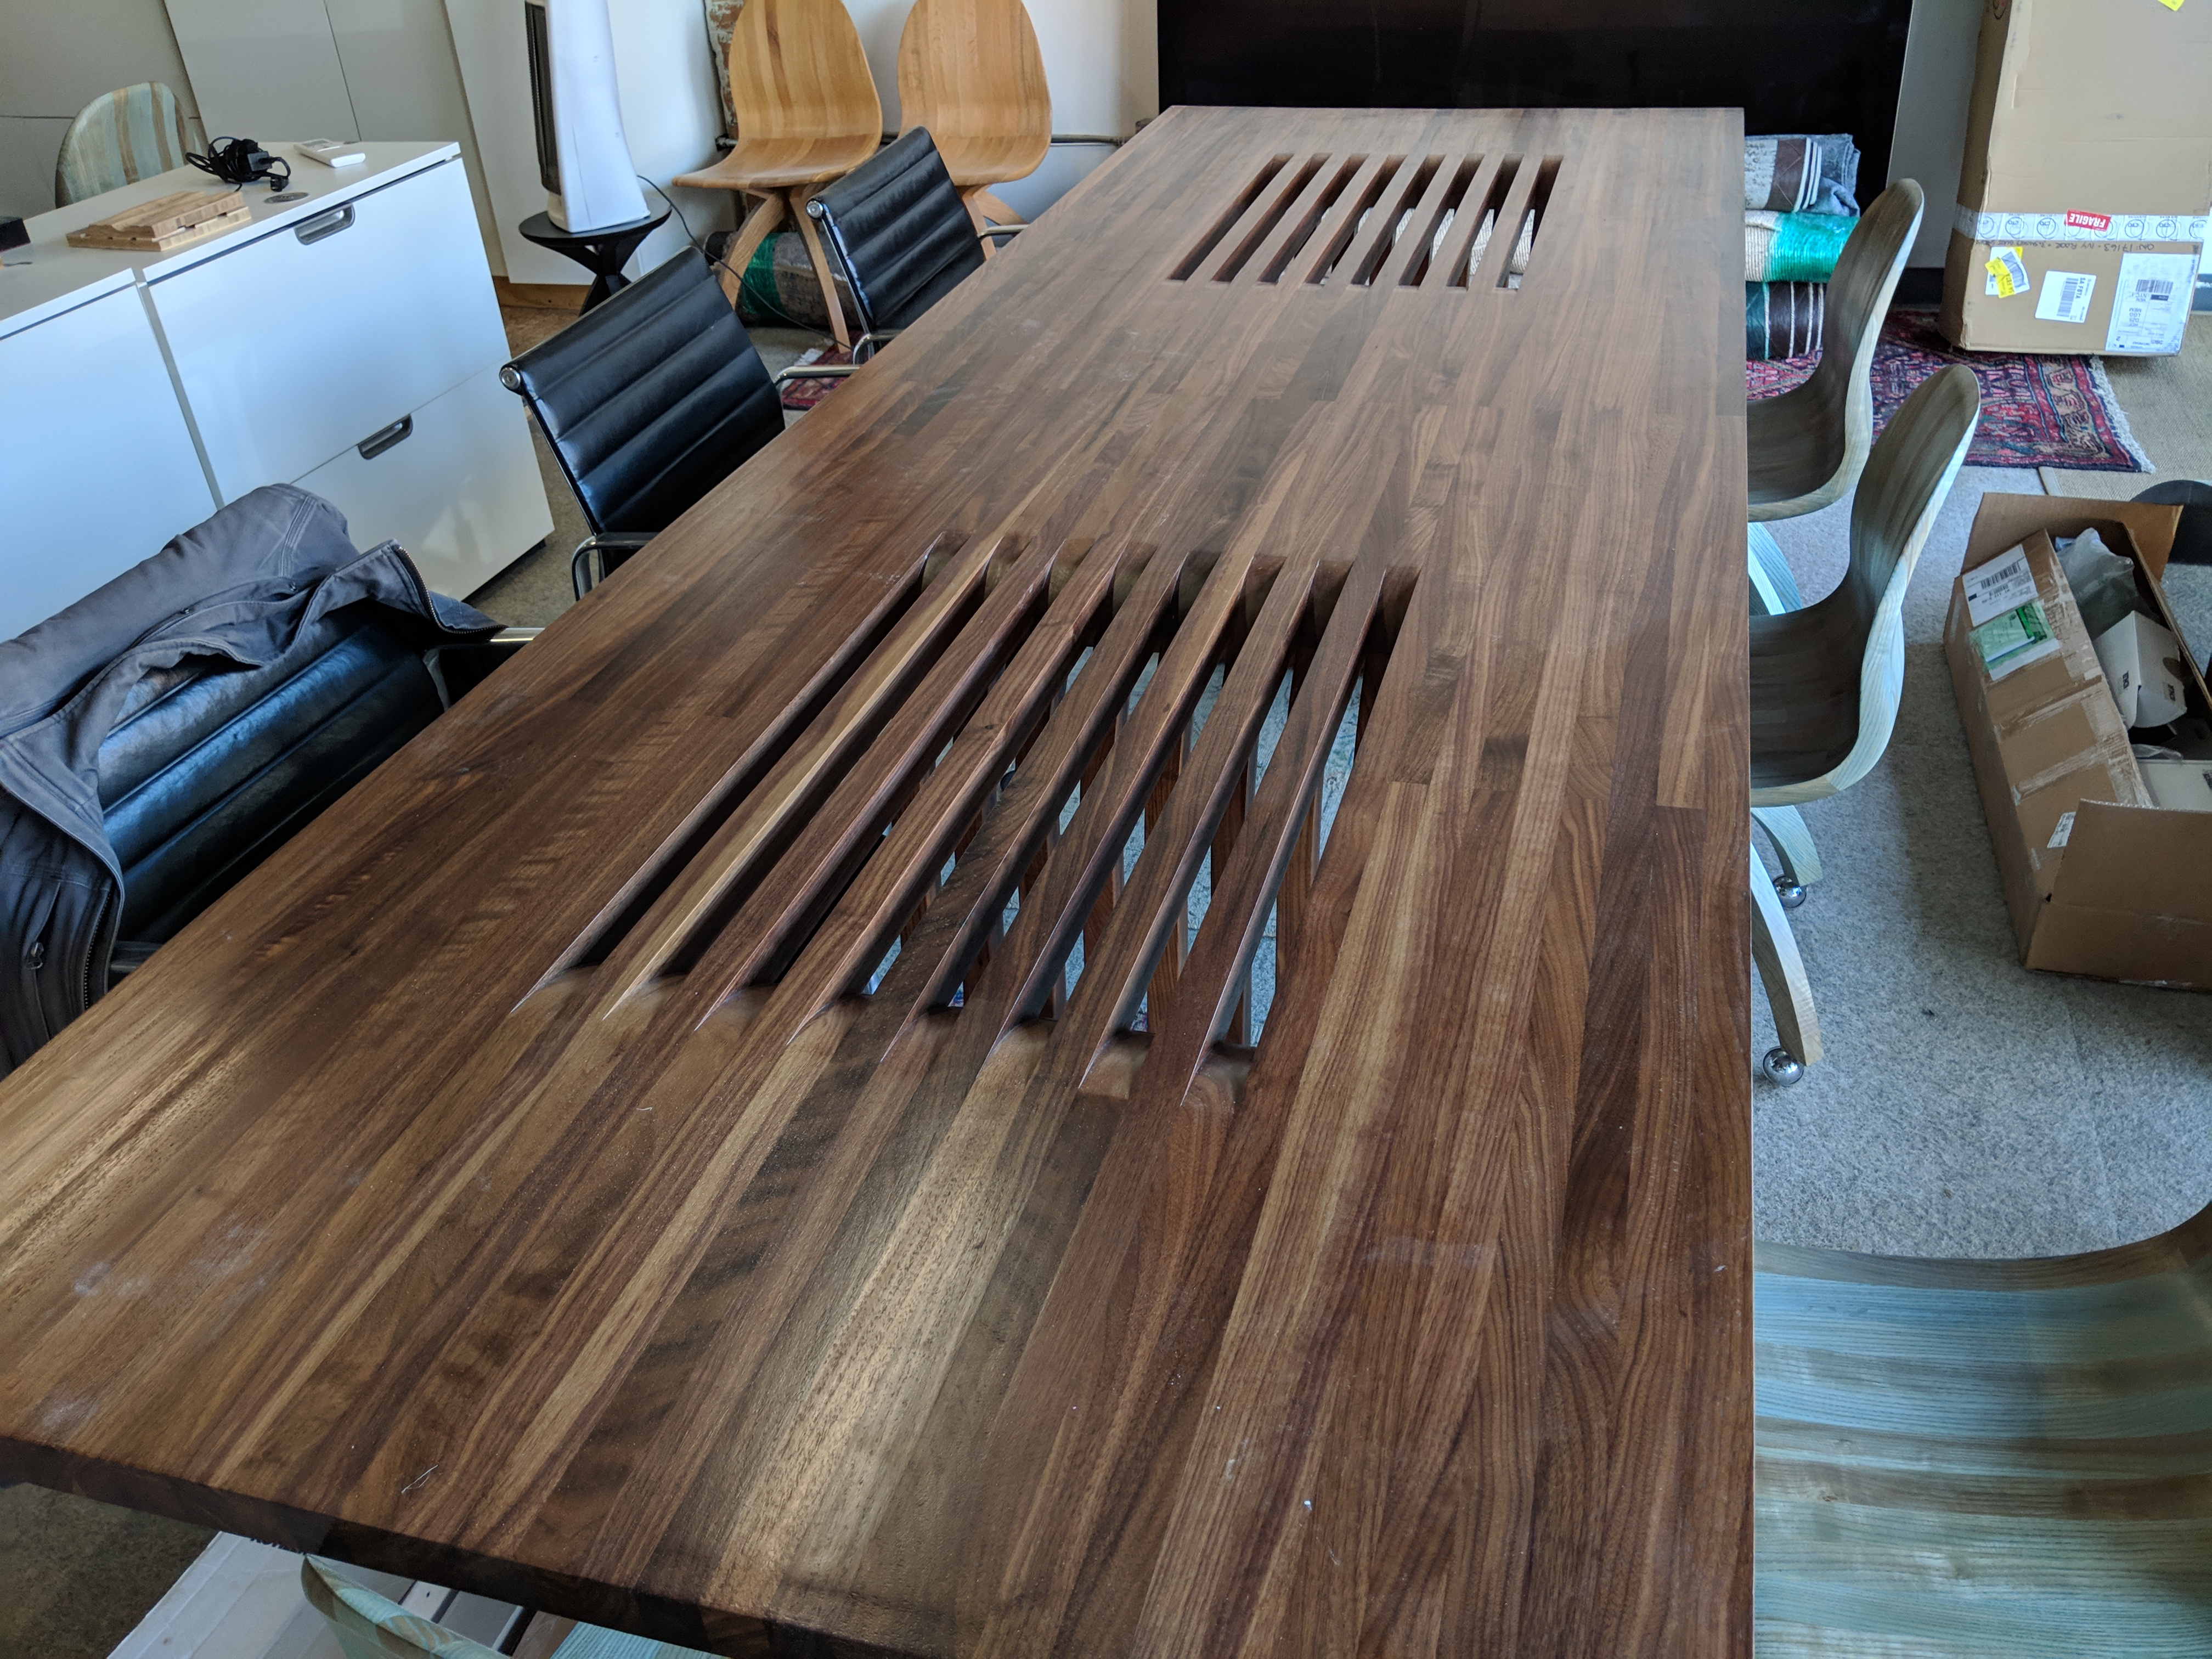
I helped re-engineer this table from a previous design. This included designing a new connection point for the legs and rethinking the CNC and slab gluing operations.
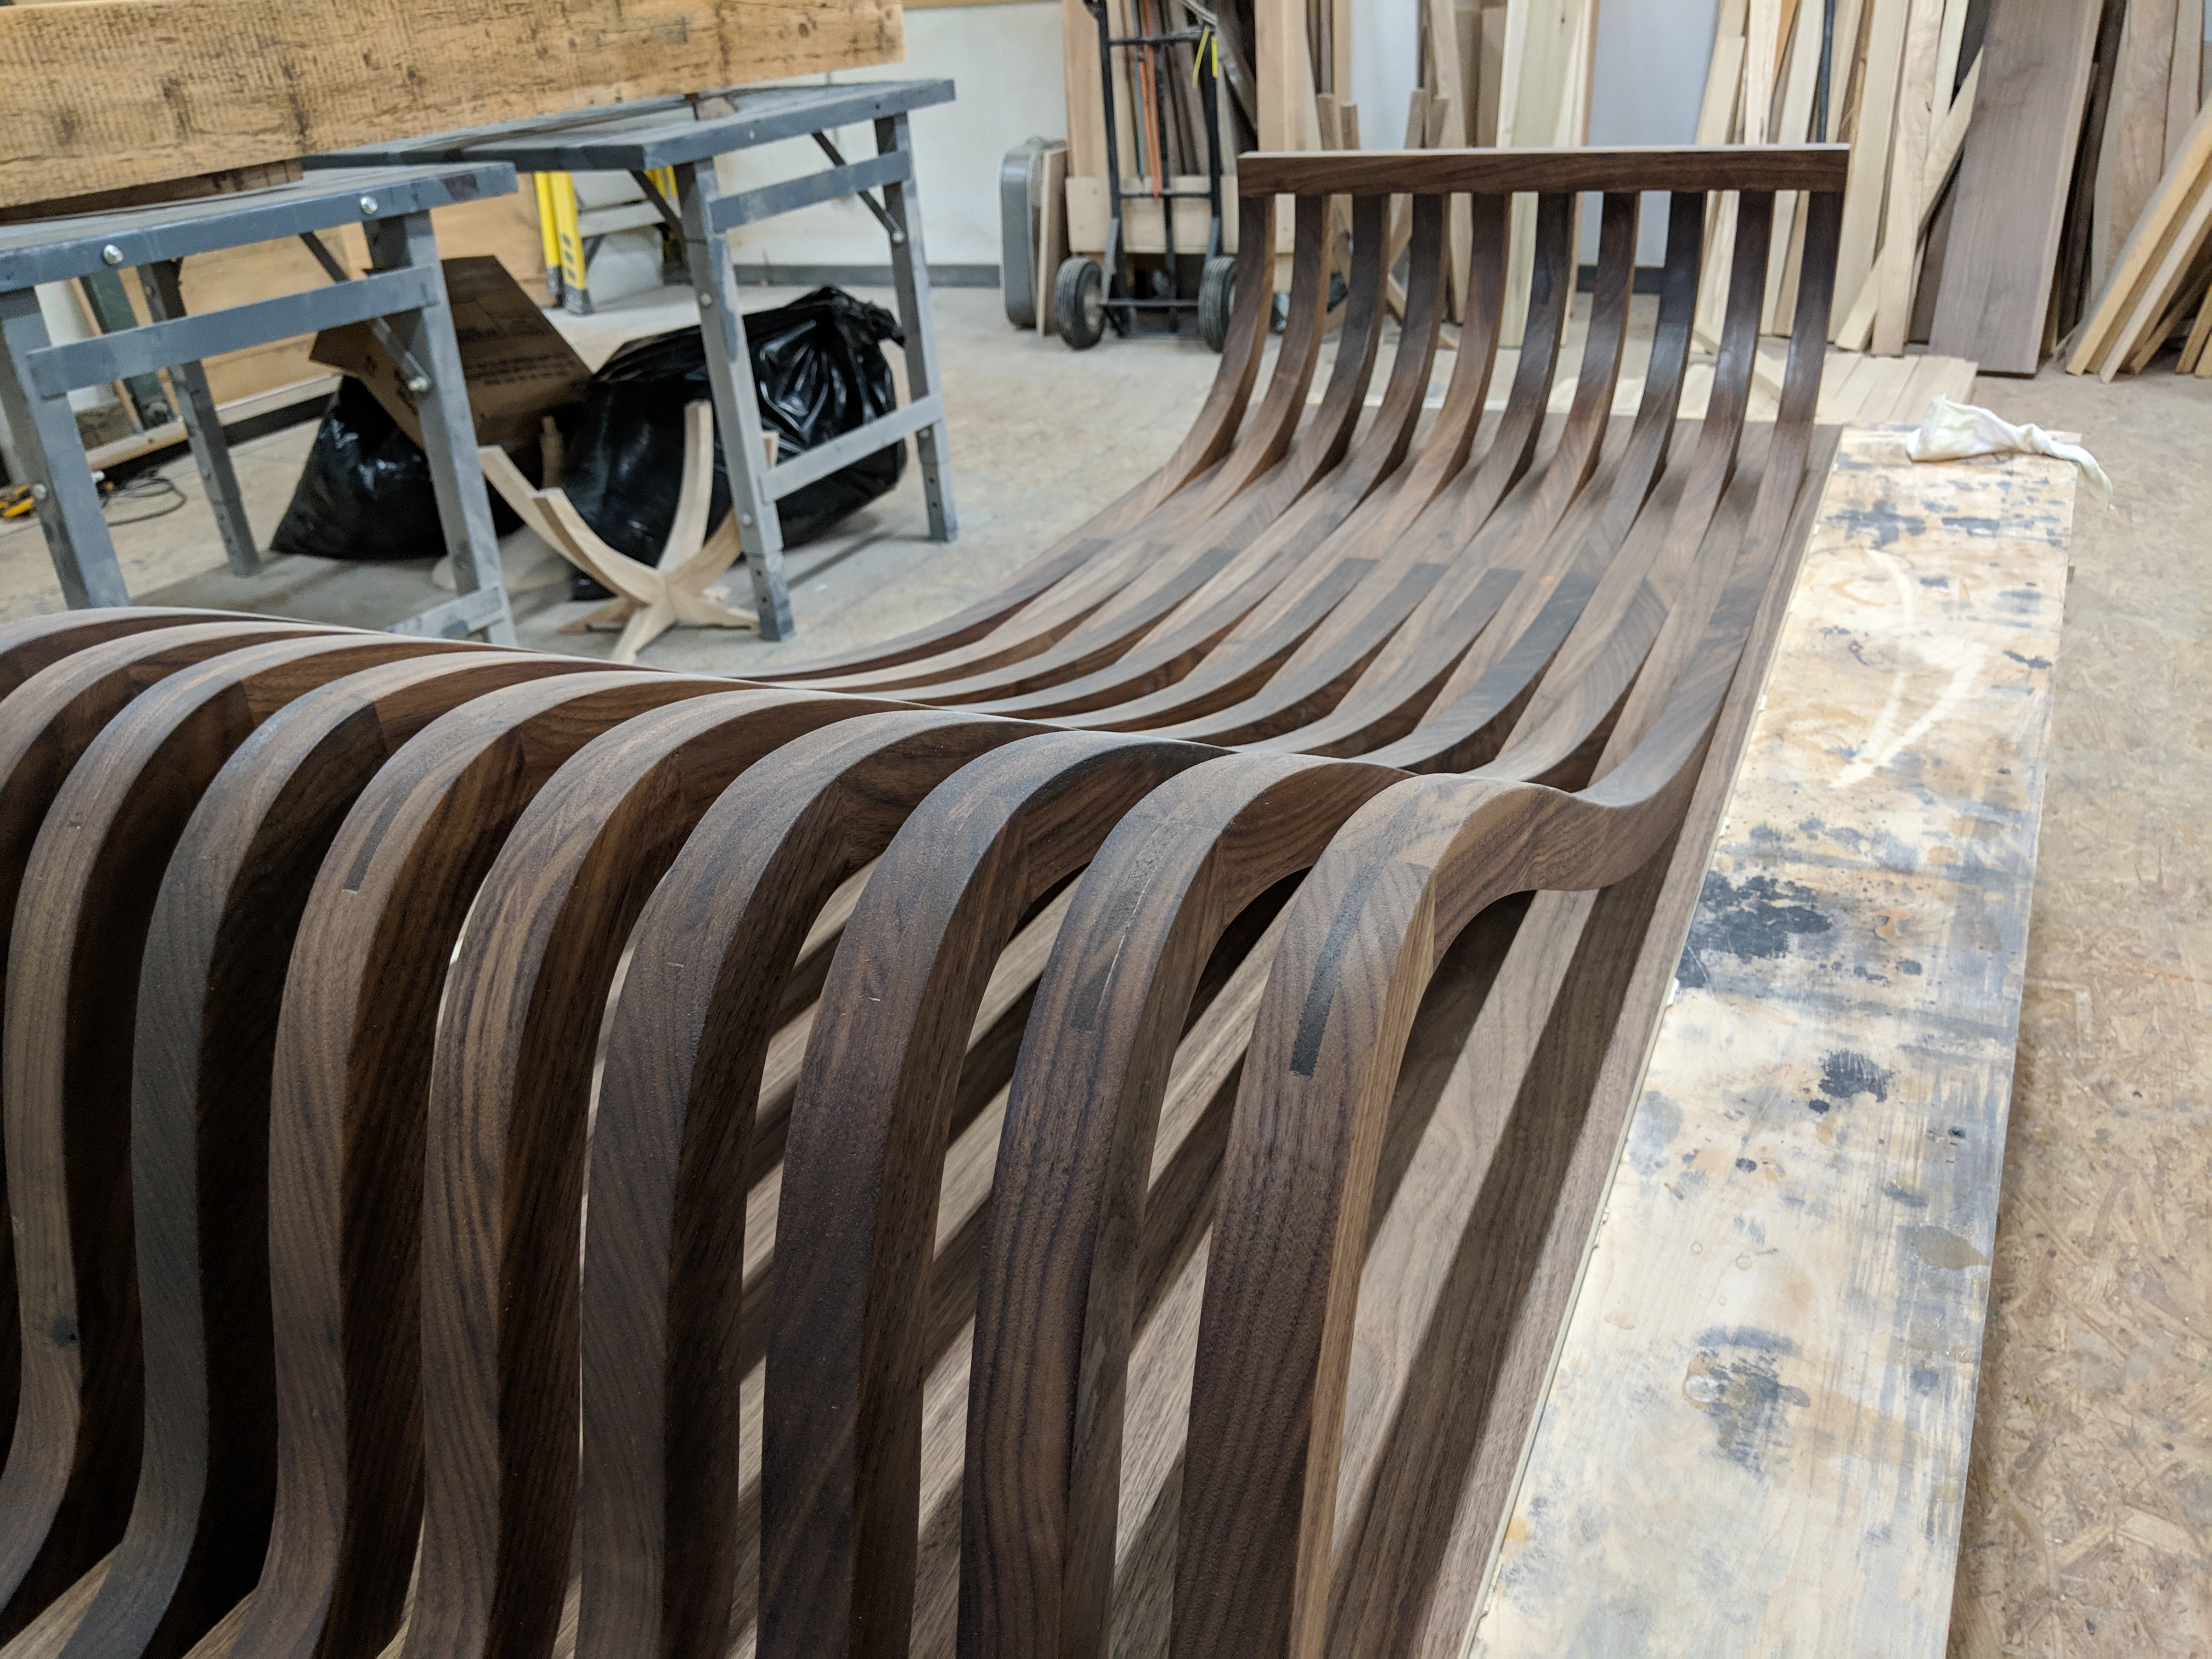
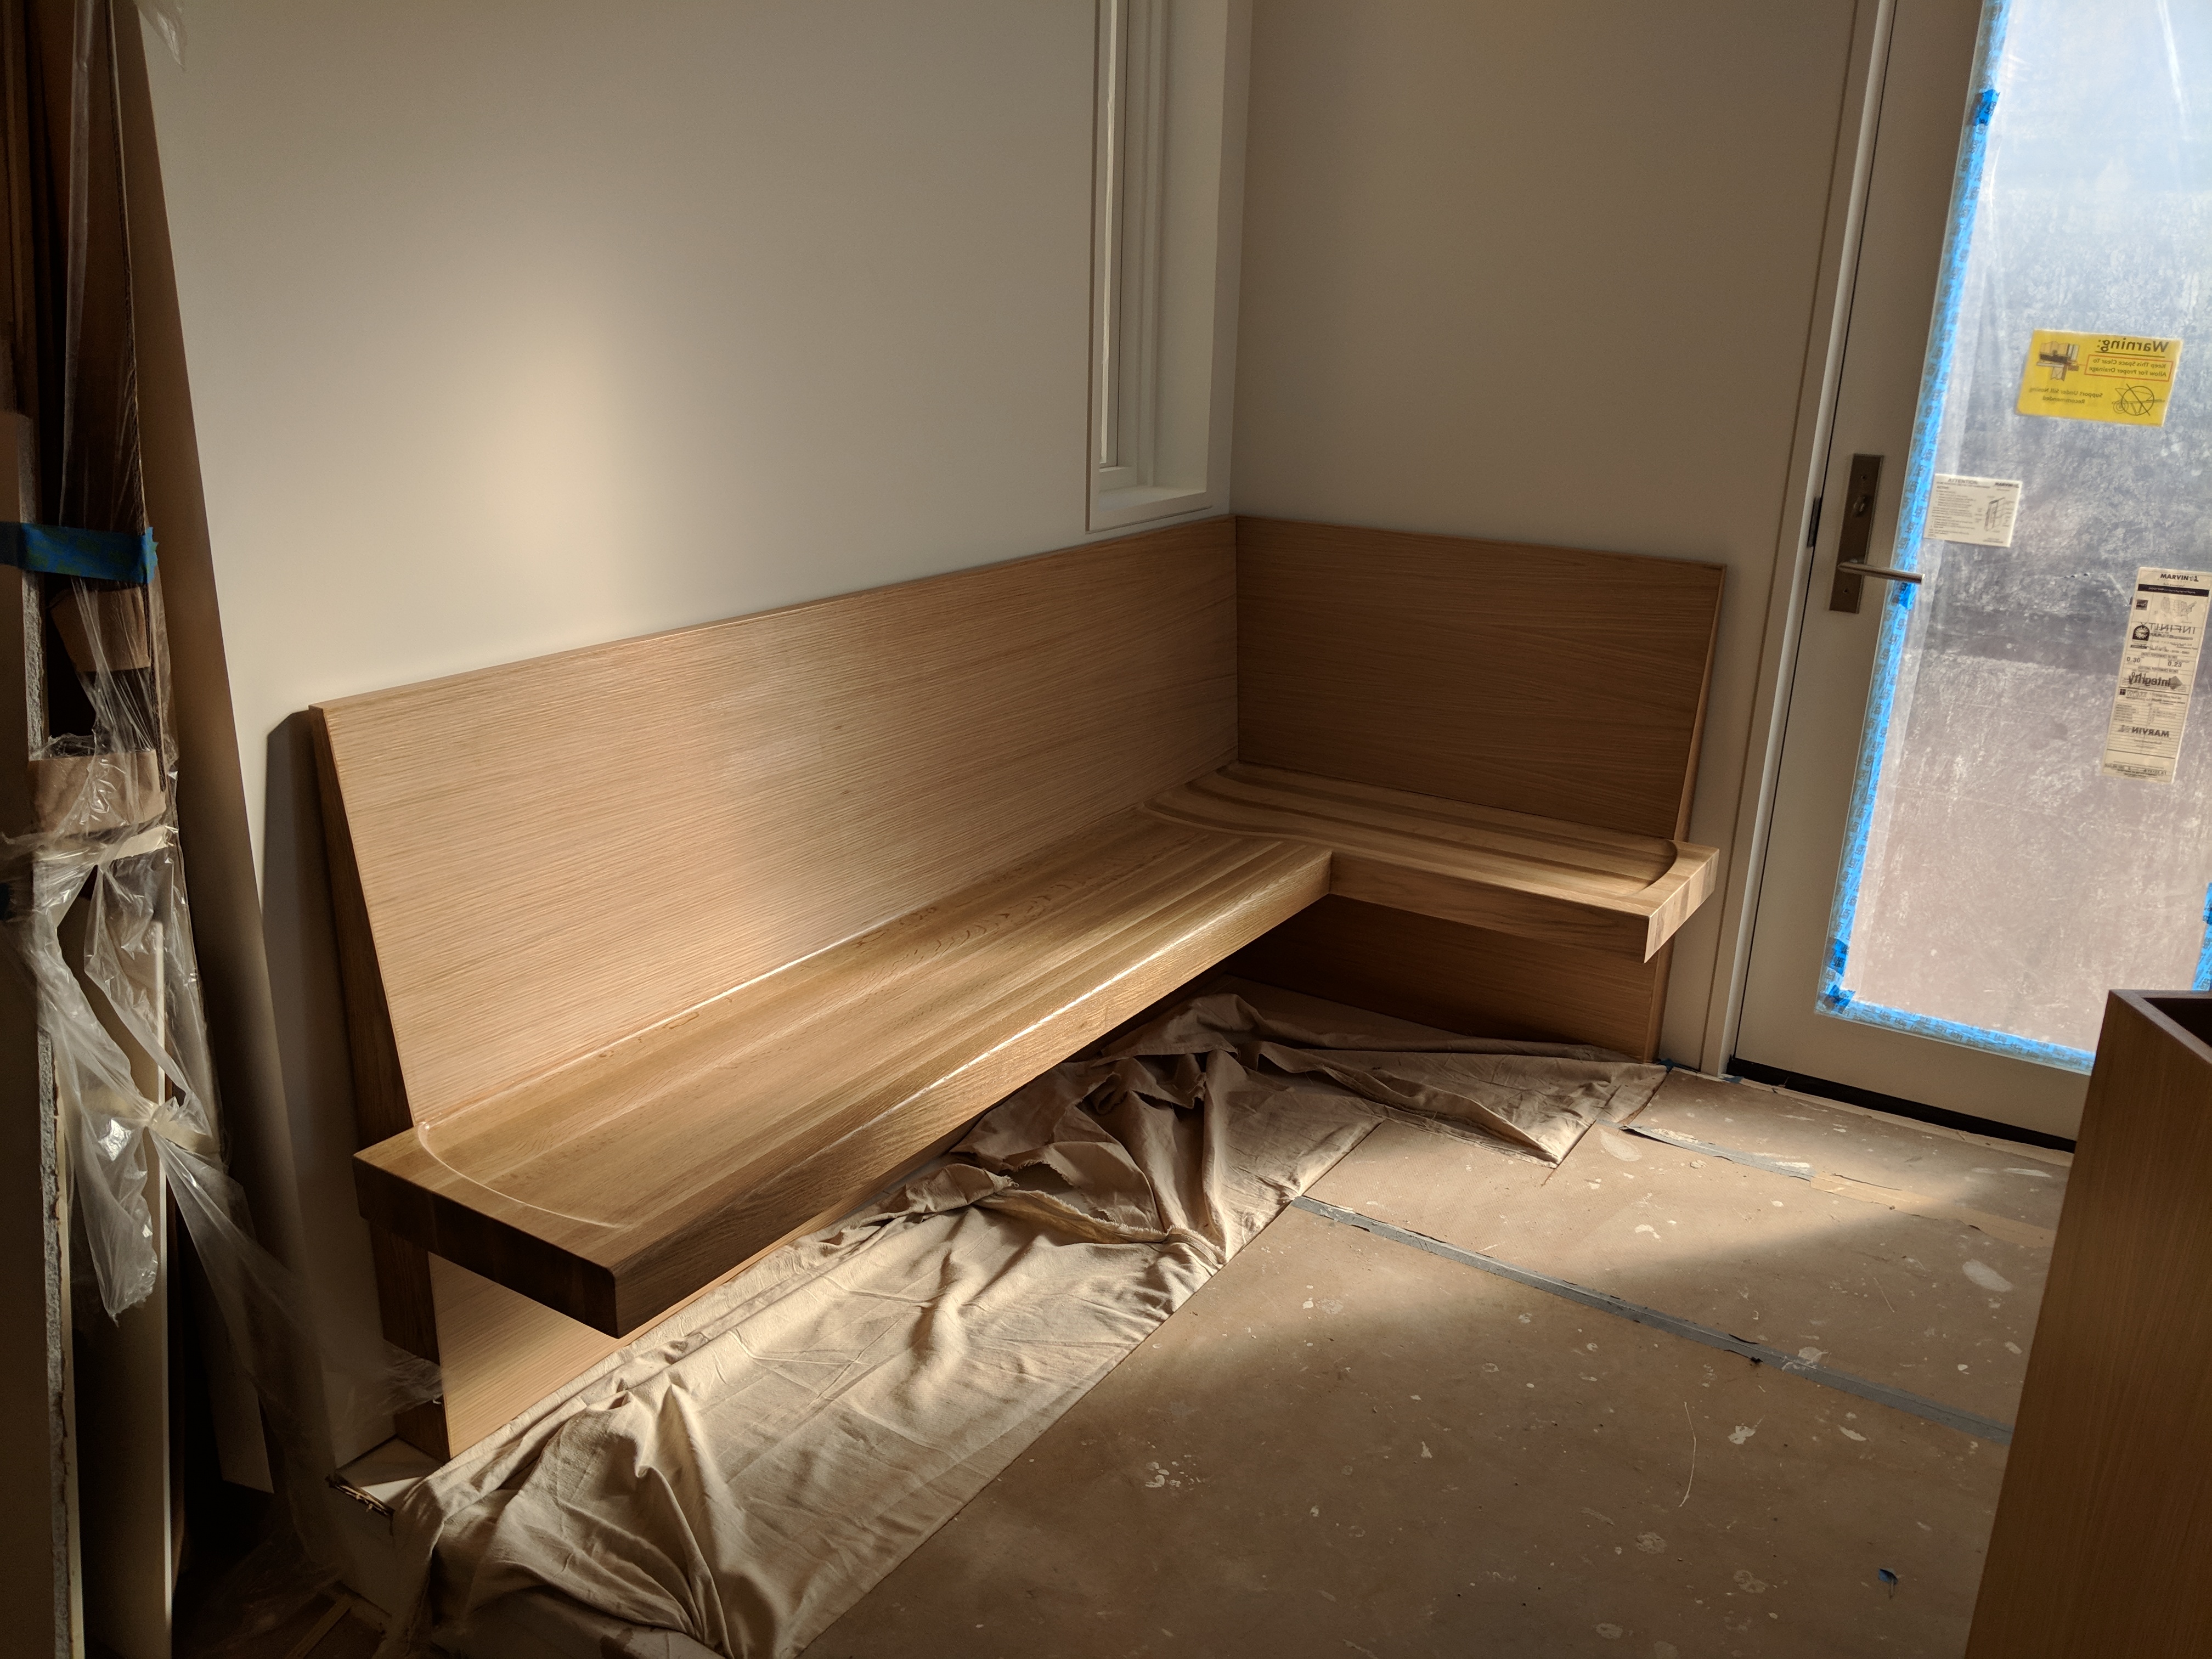
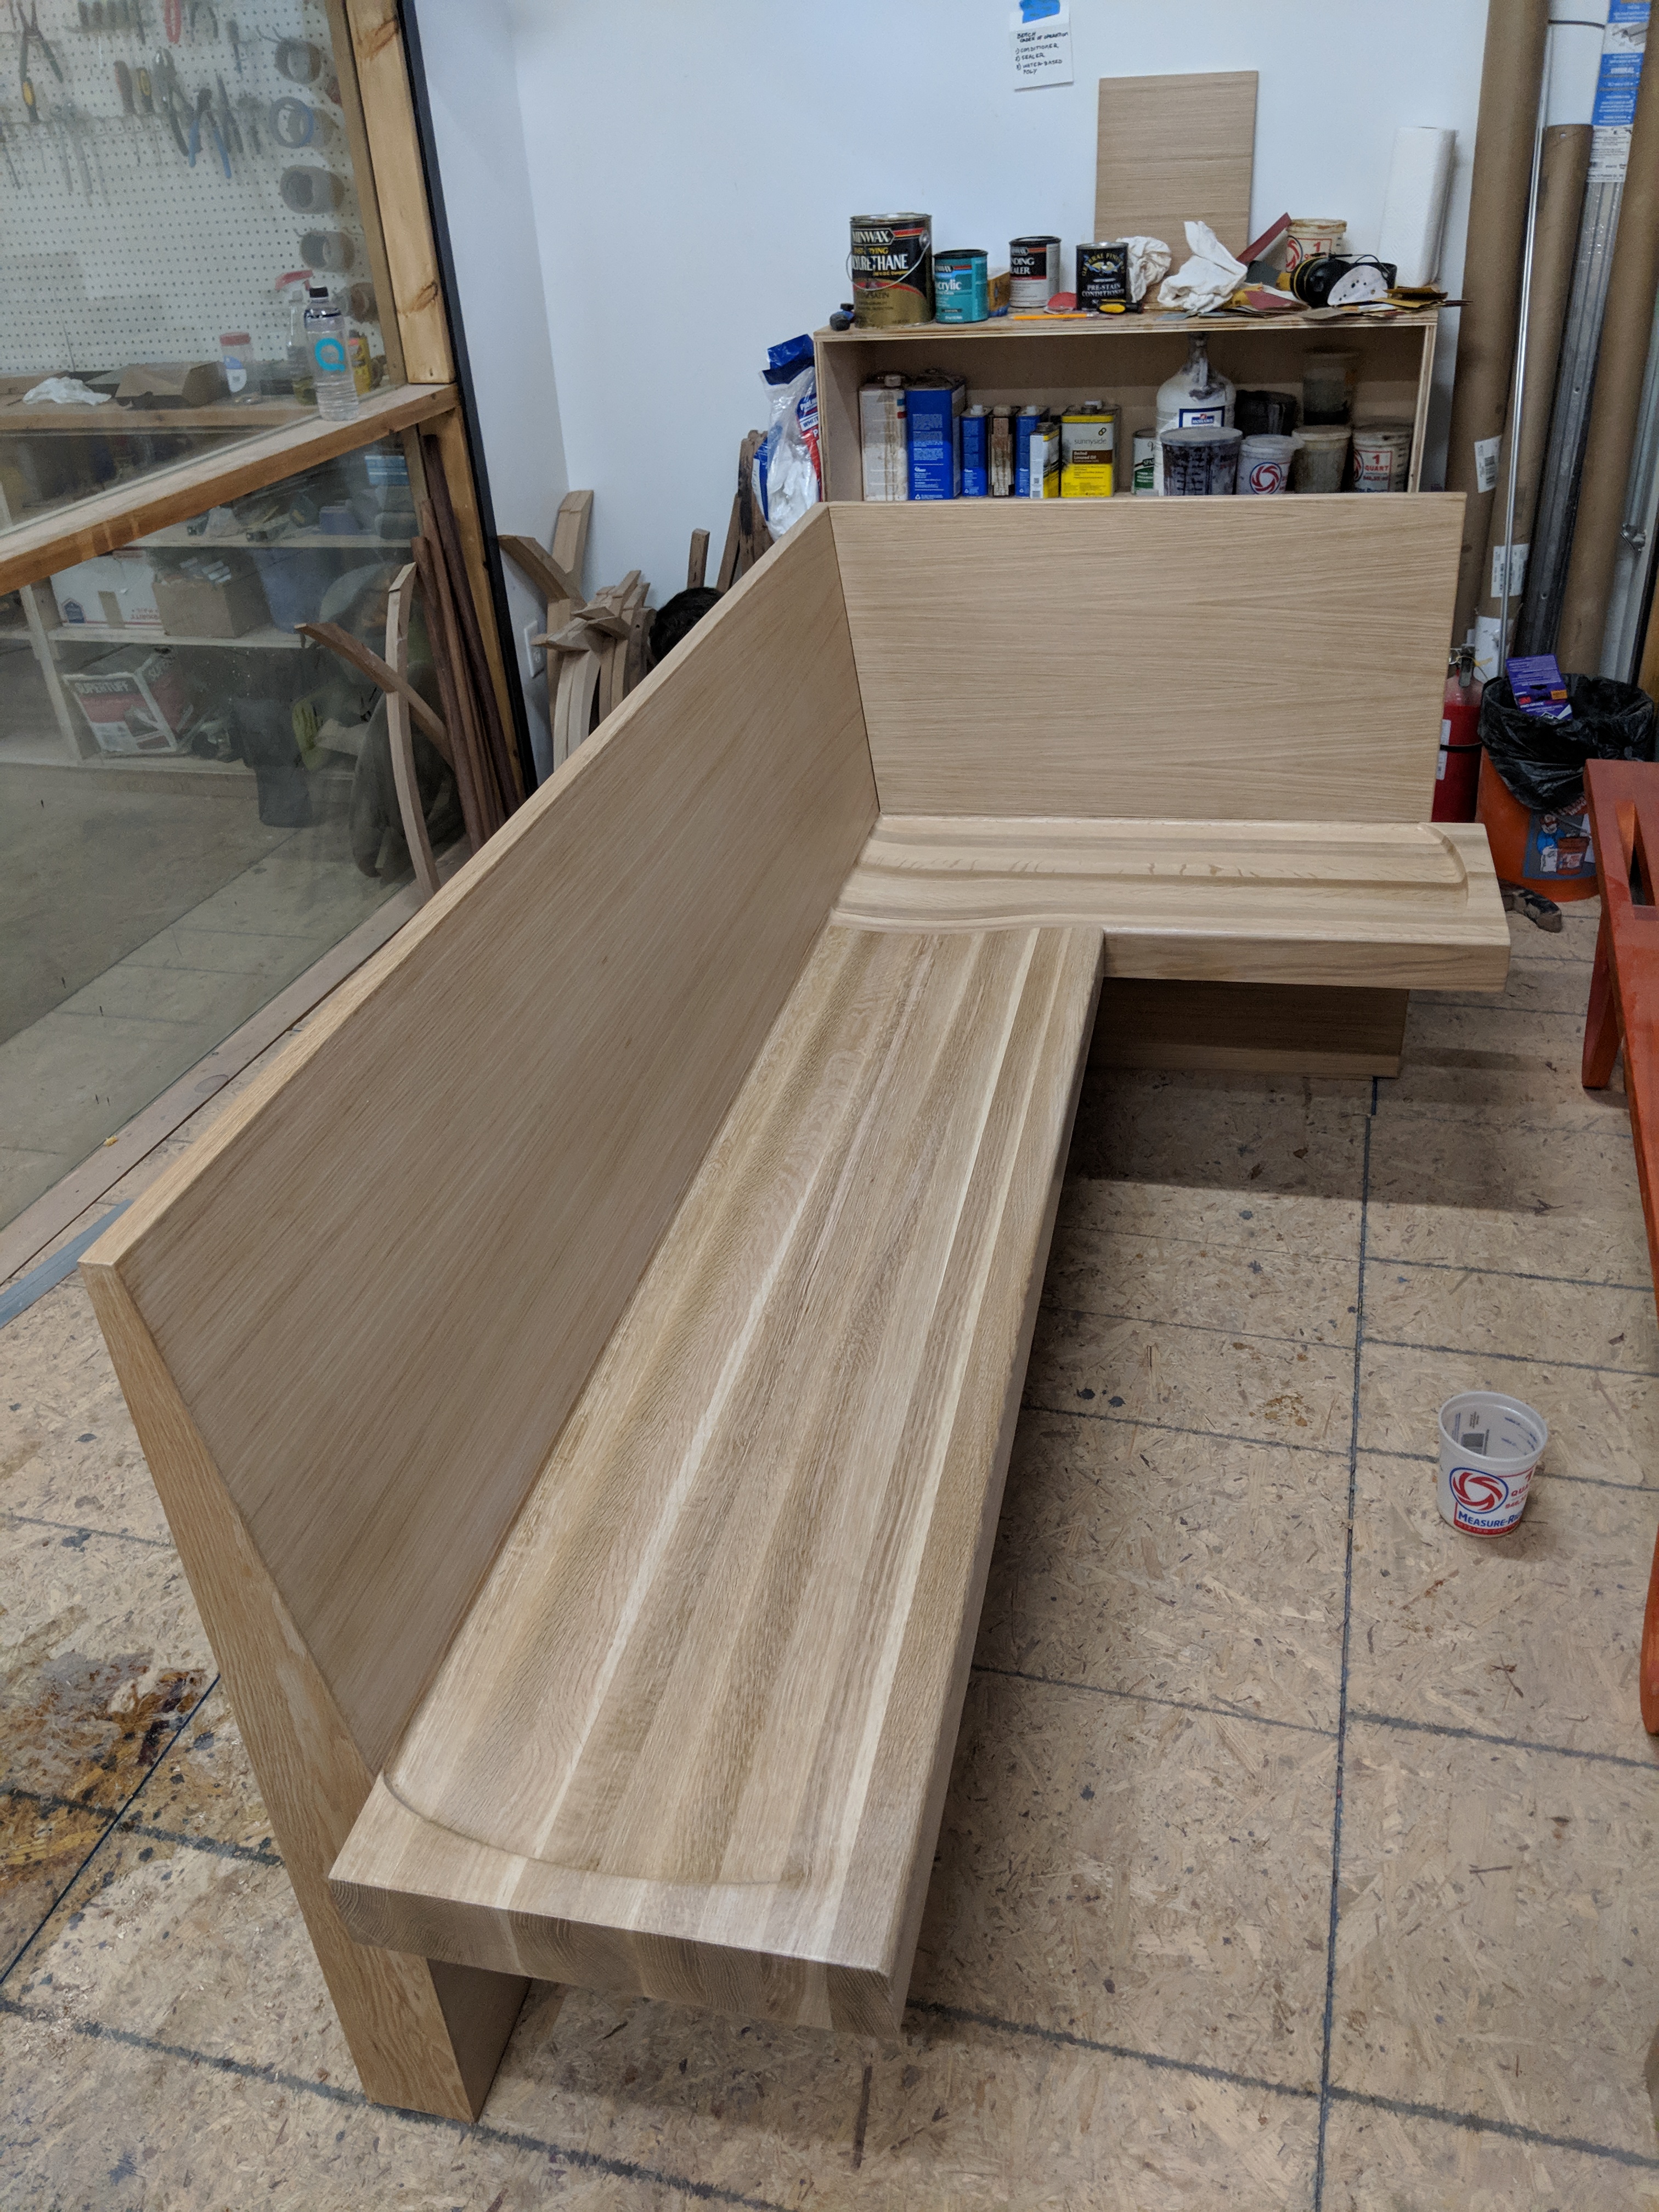
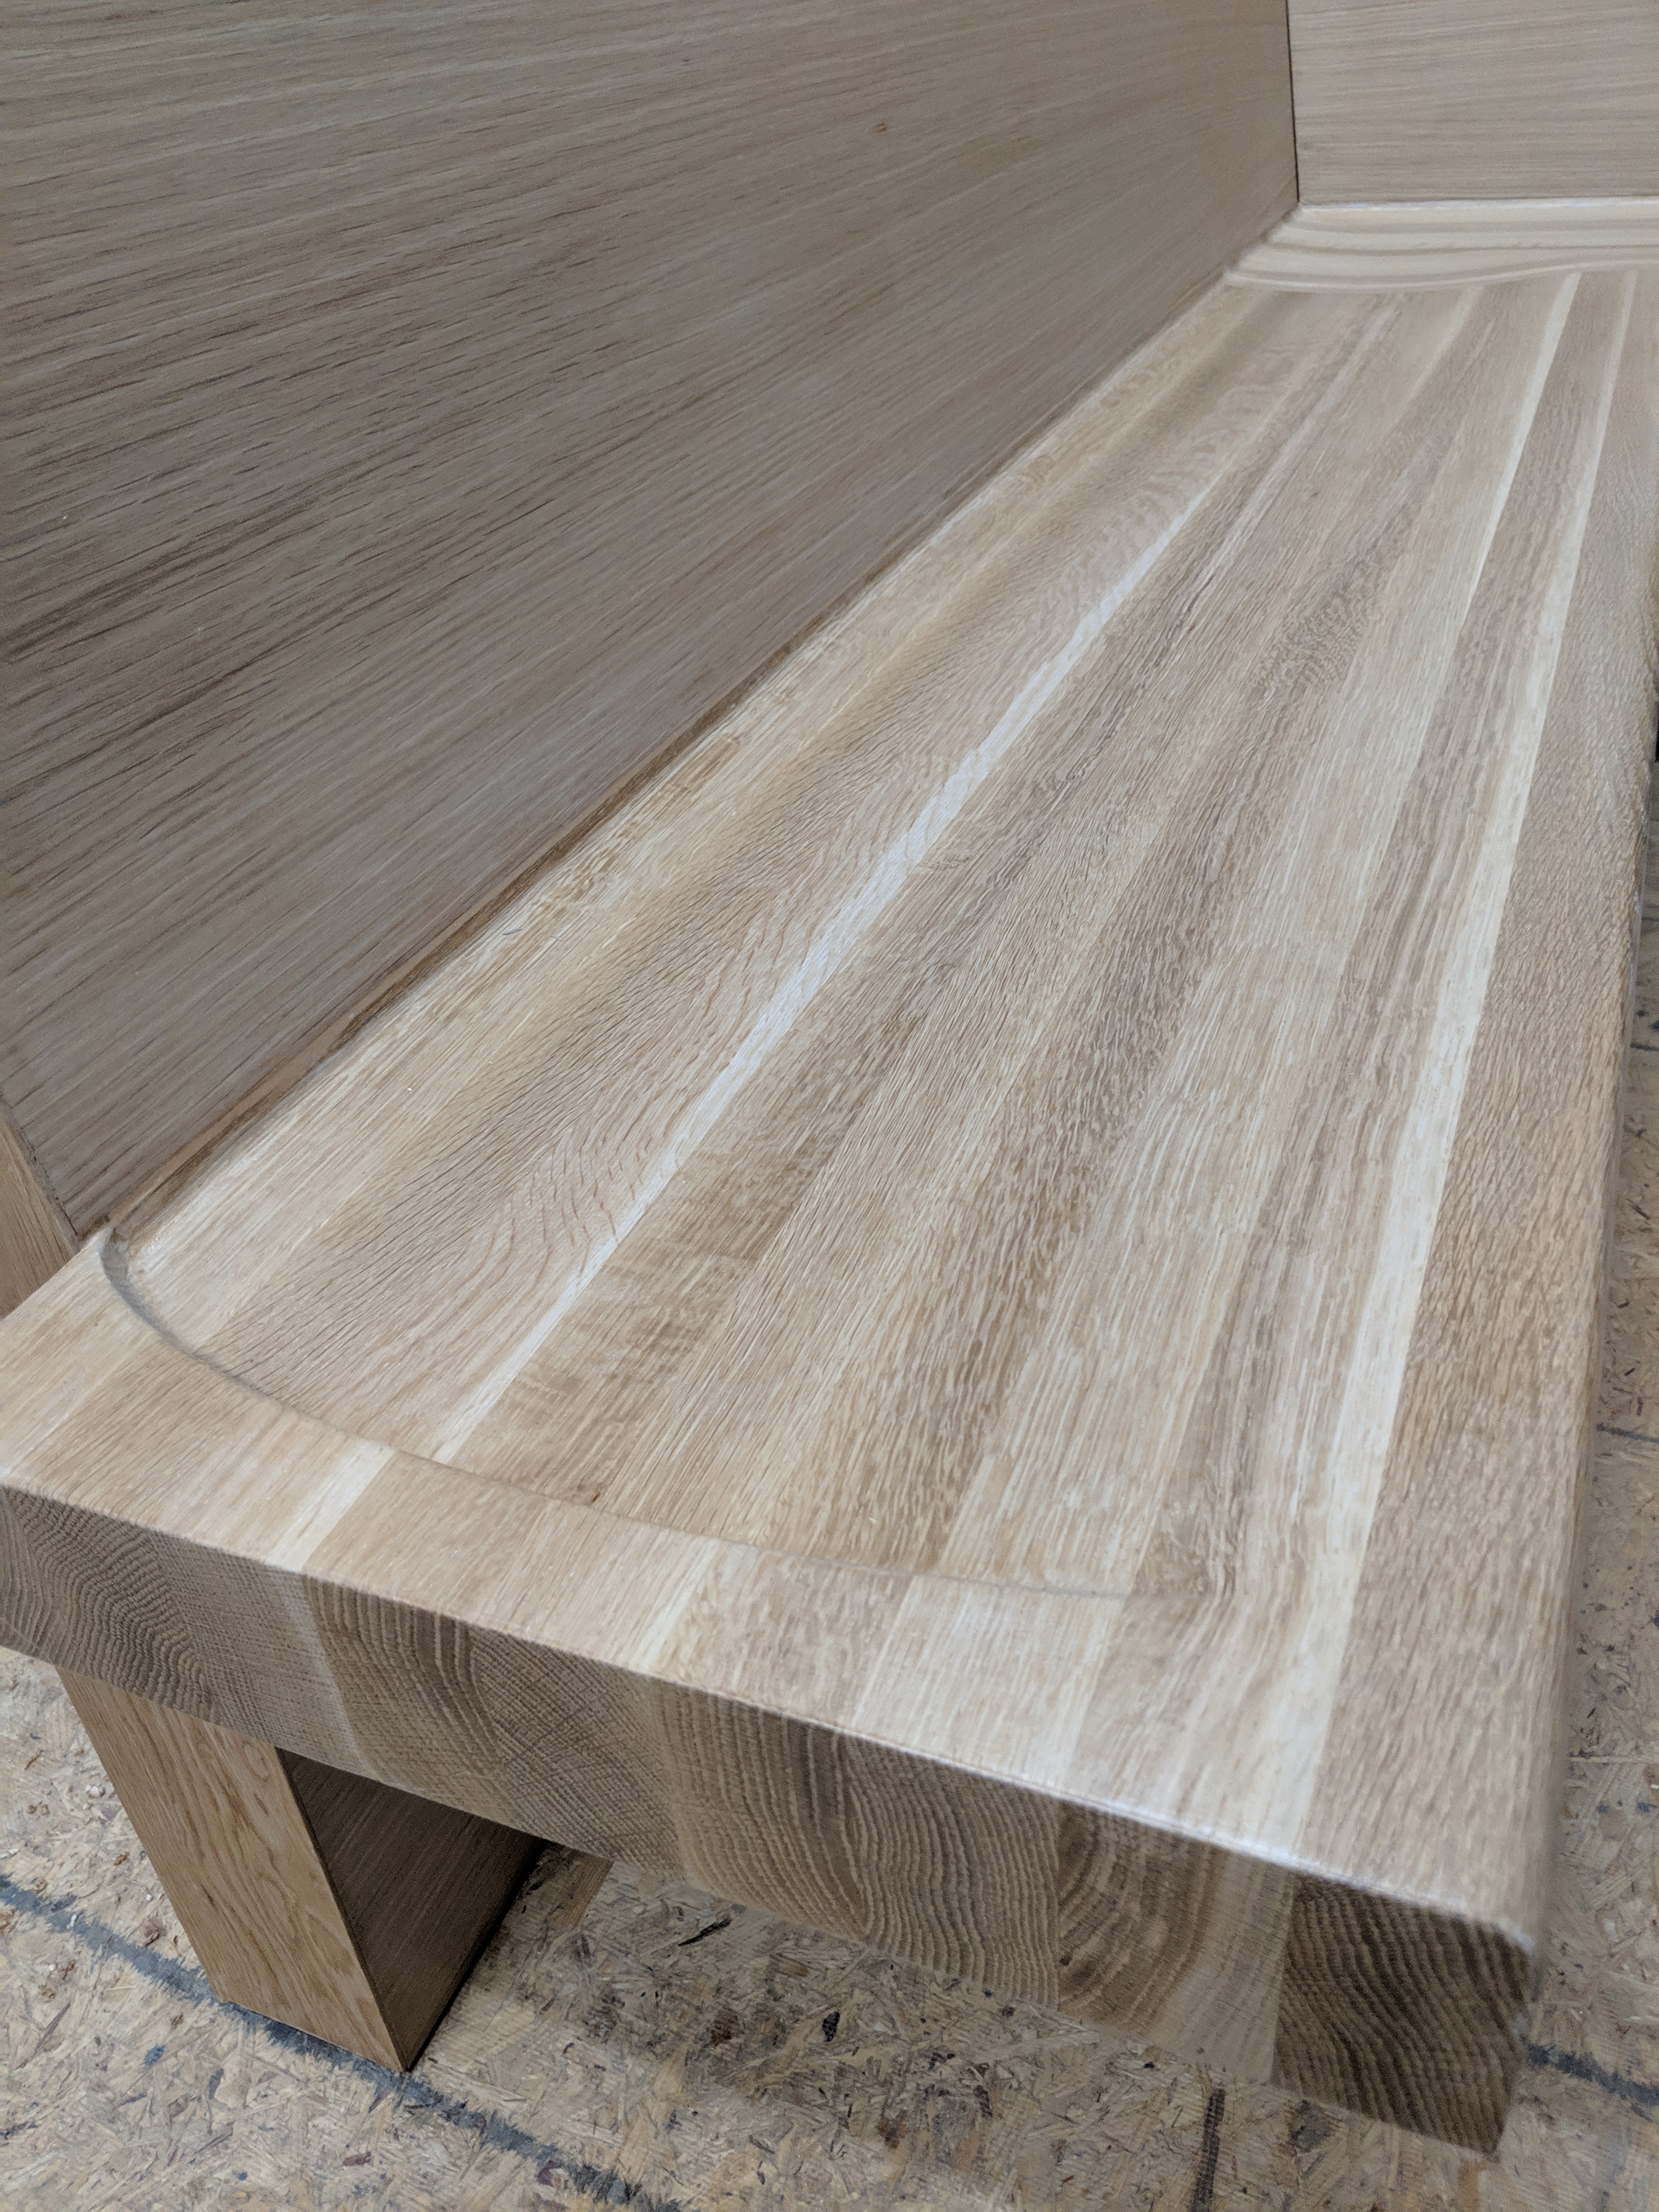
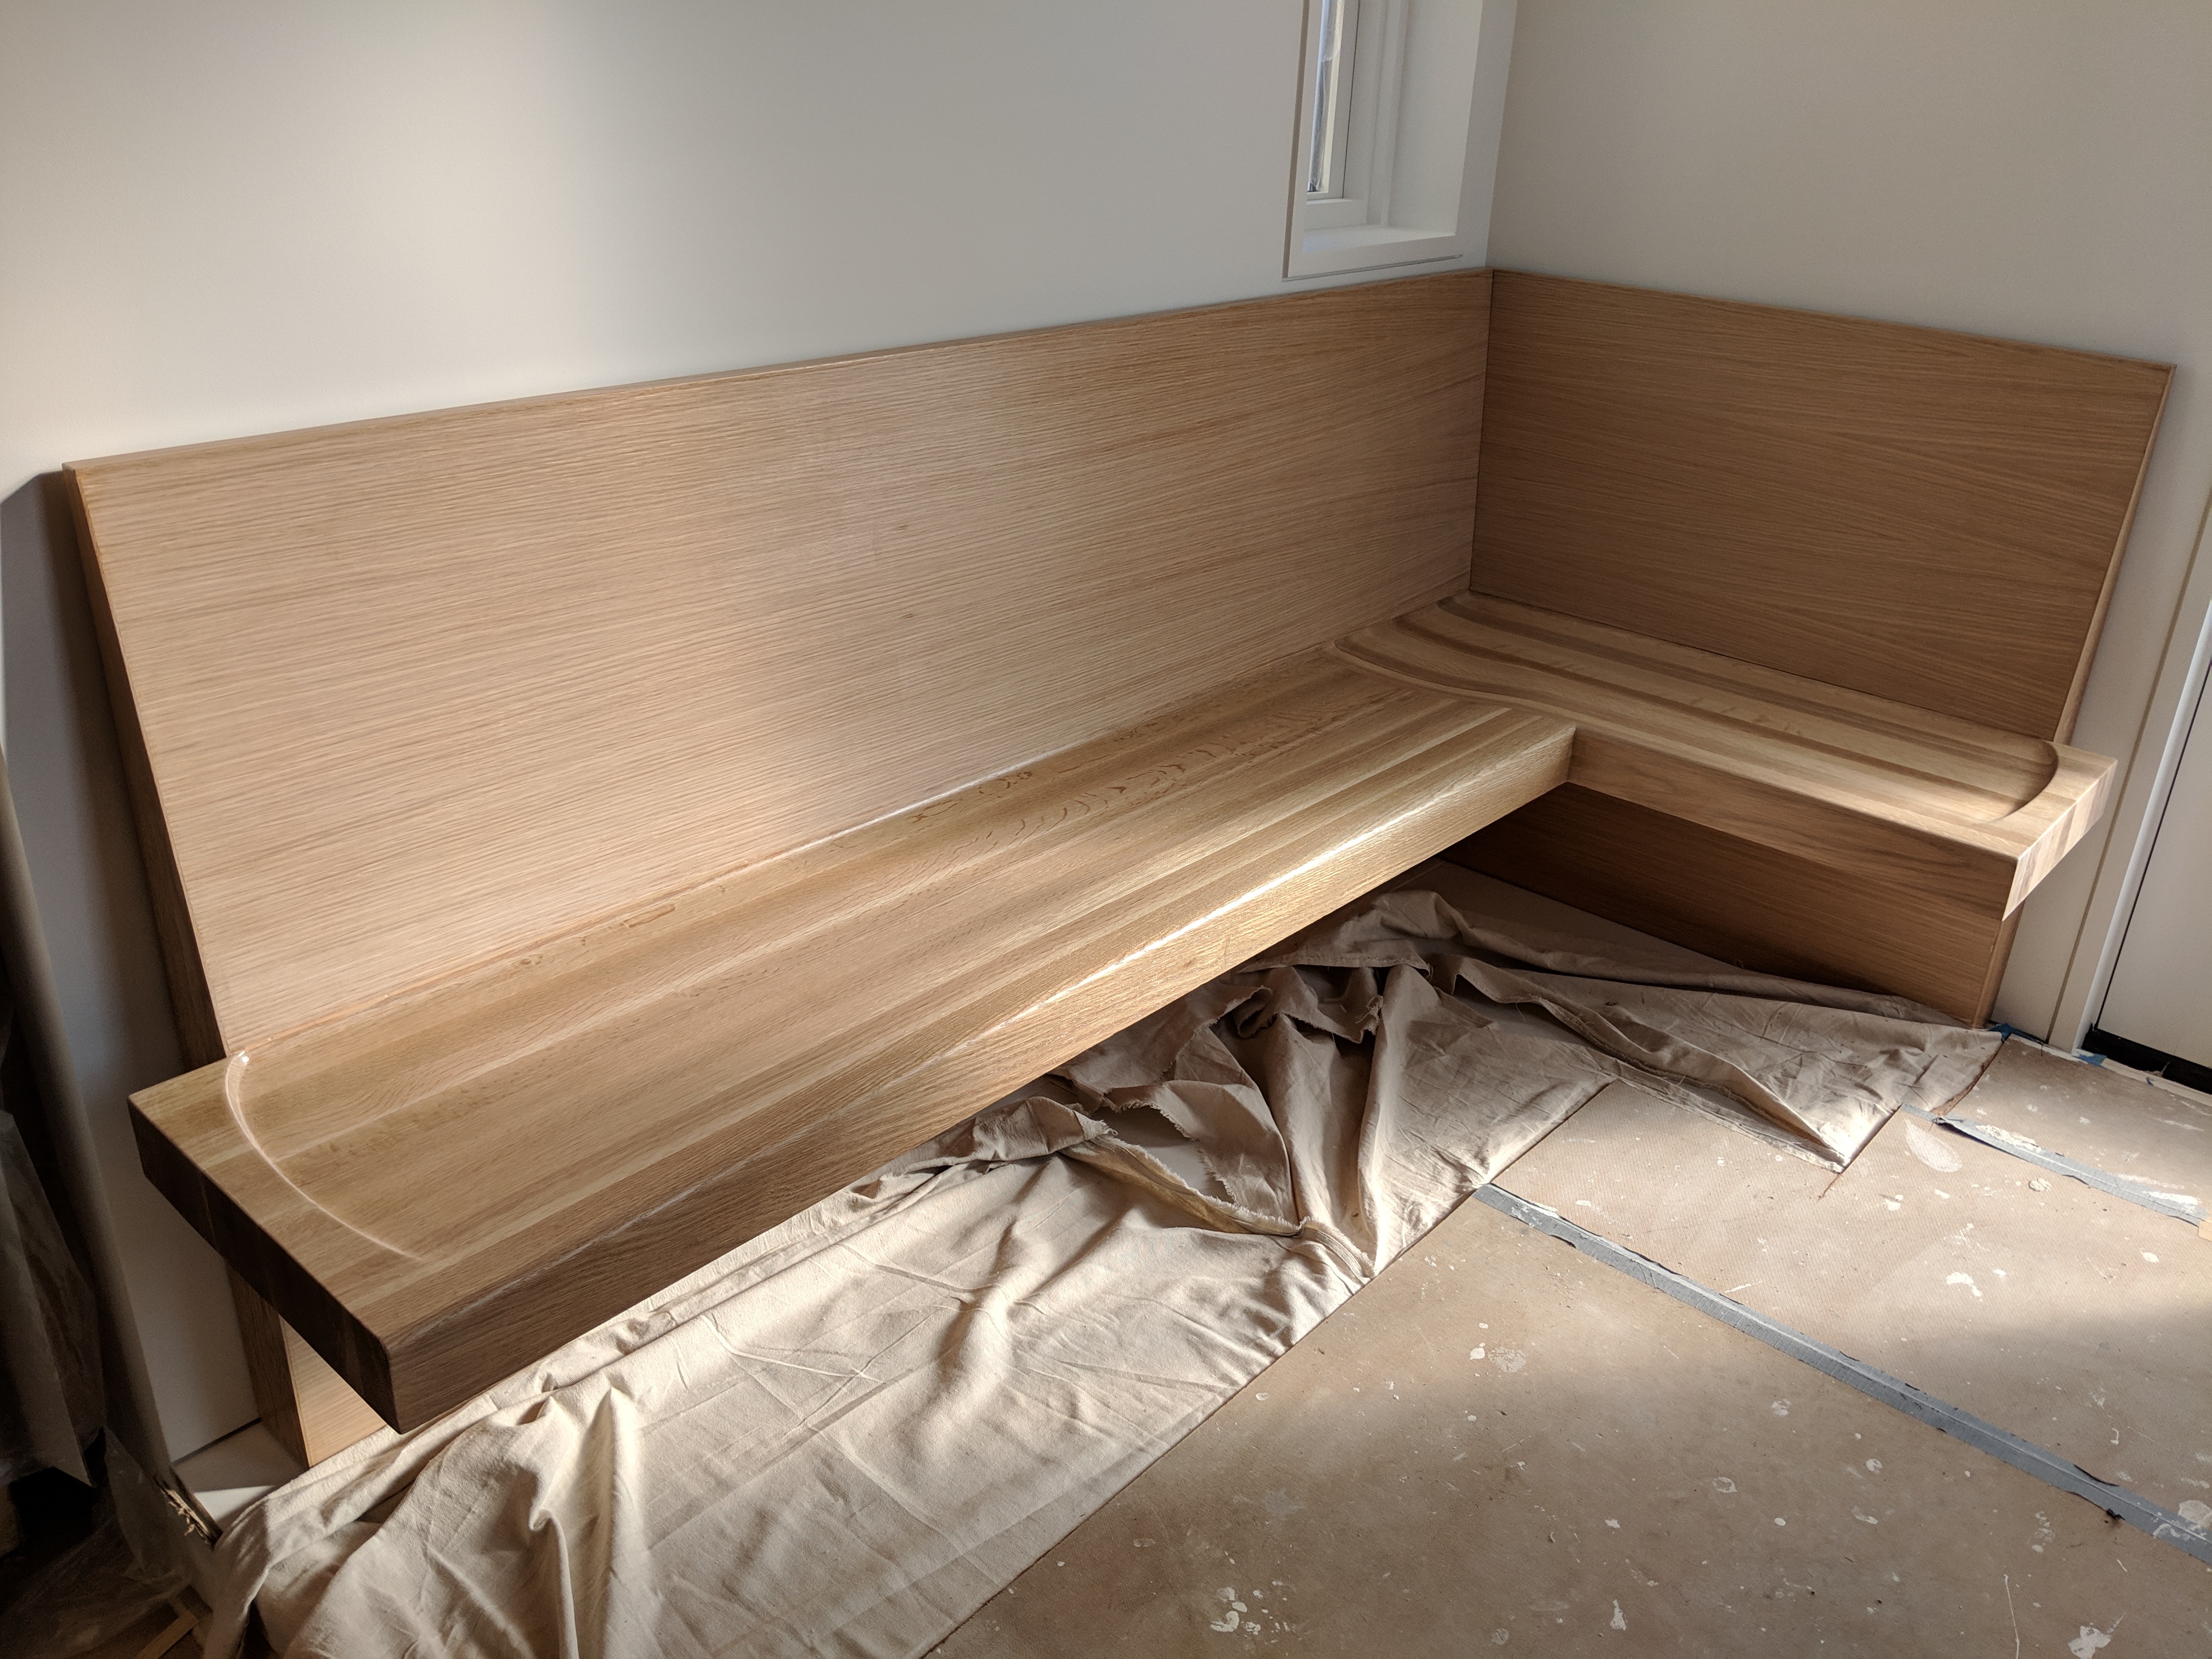
I worked out the construction and installation of this banquette from the designers 3d model.
This included the interenal structure, part sourcing and order of operations from CNC milling to getting the perfect natural finish.


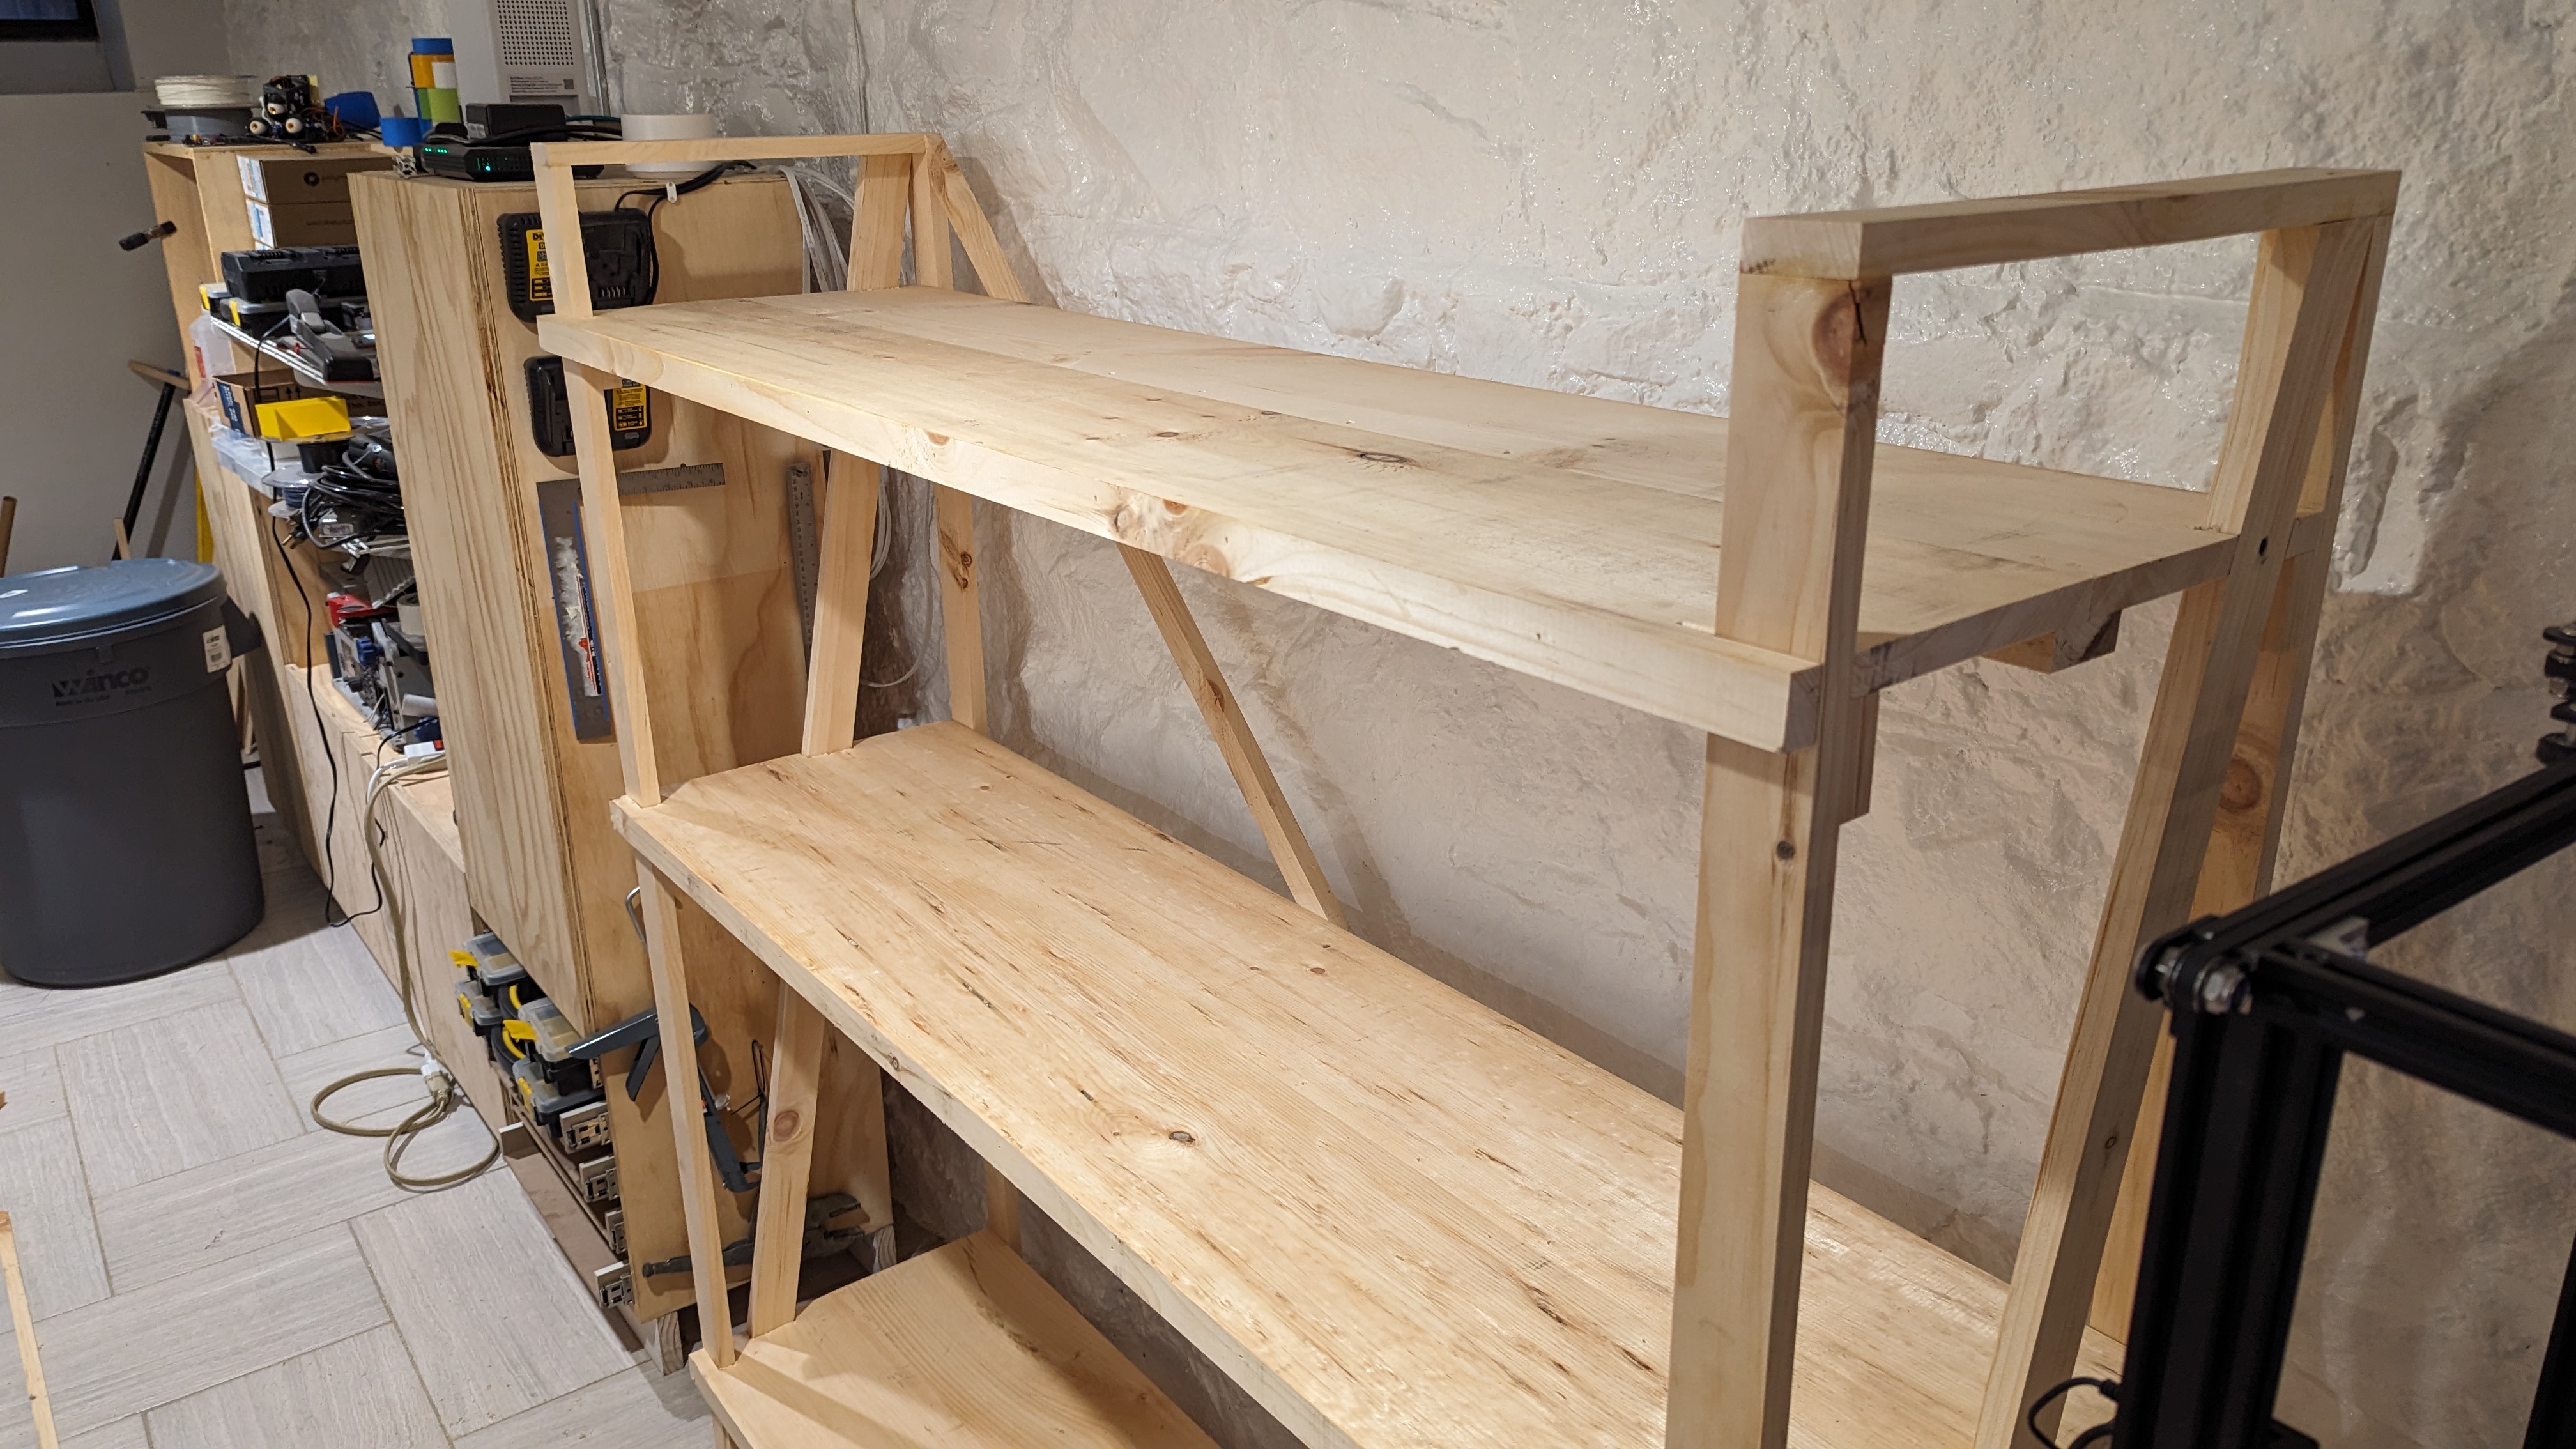
A weekend project to design and build a shelf with planks left-over from a previous project.
This project also gave me the oportunity to prototype a design for a larger set of shelves I am going to build for our household storage area.




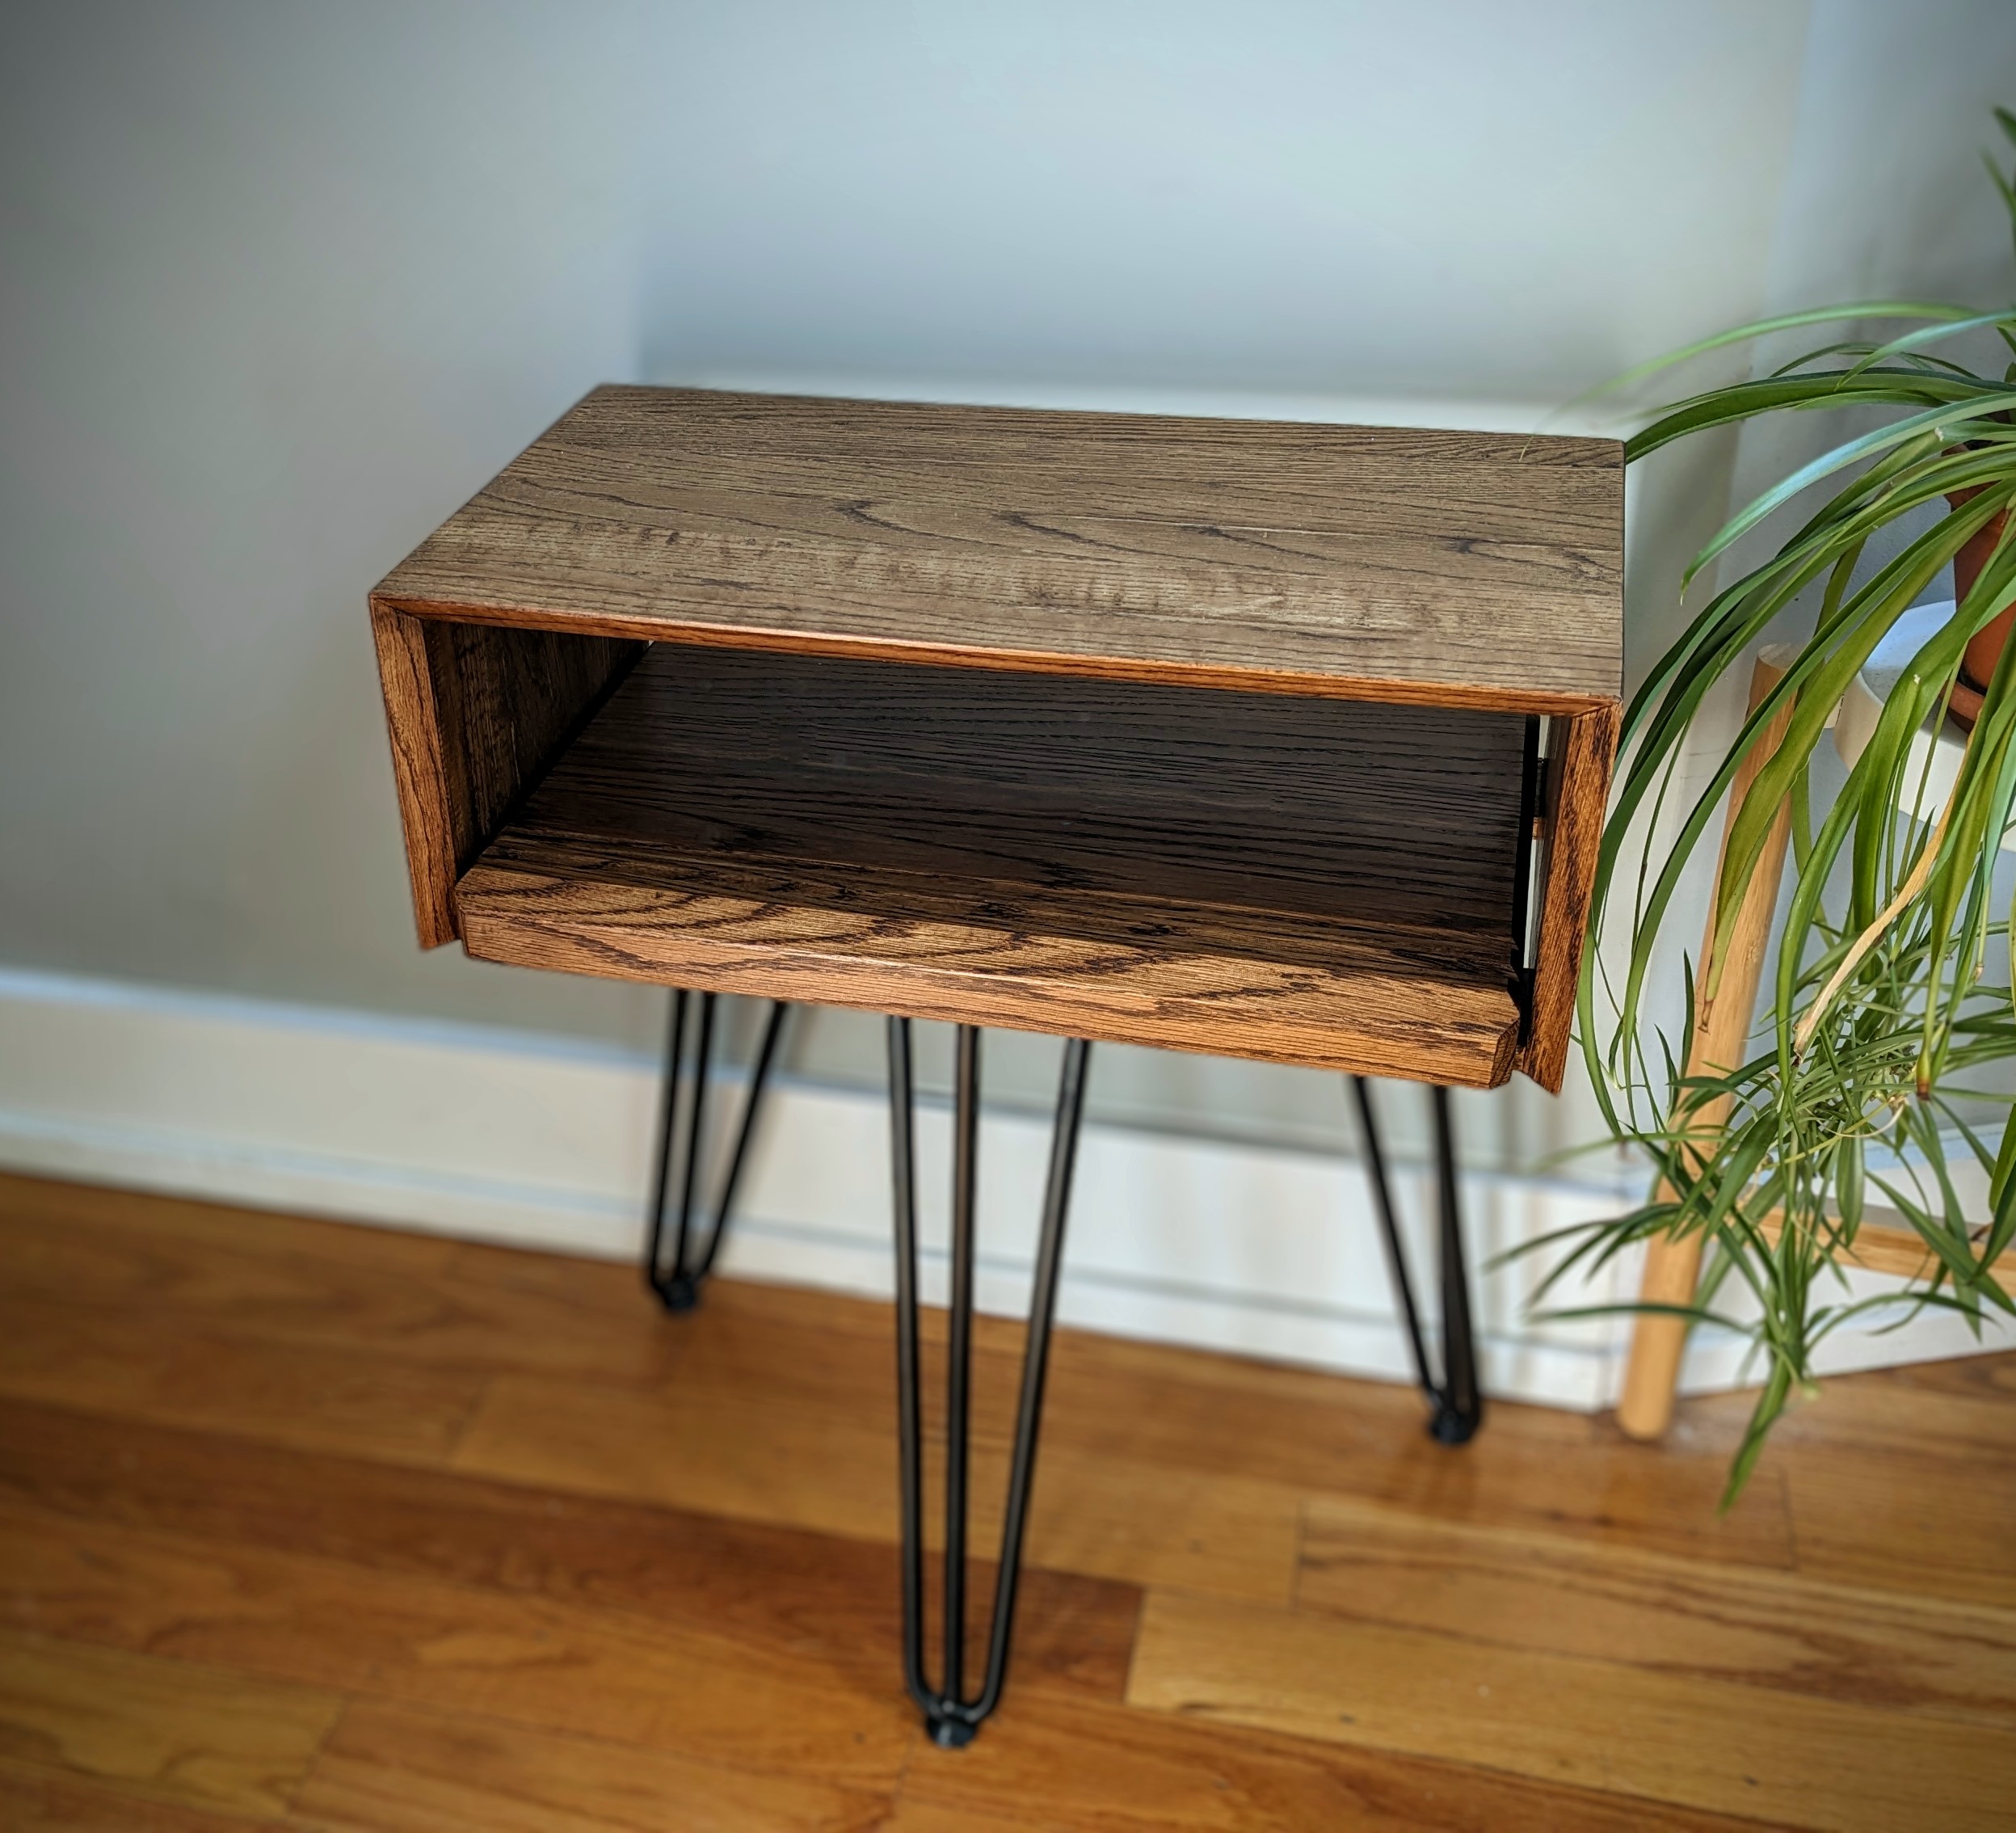
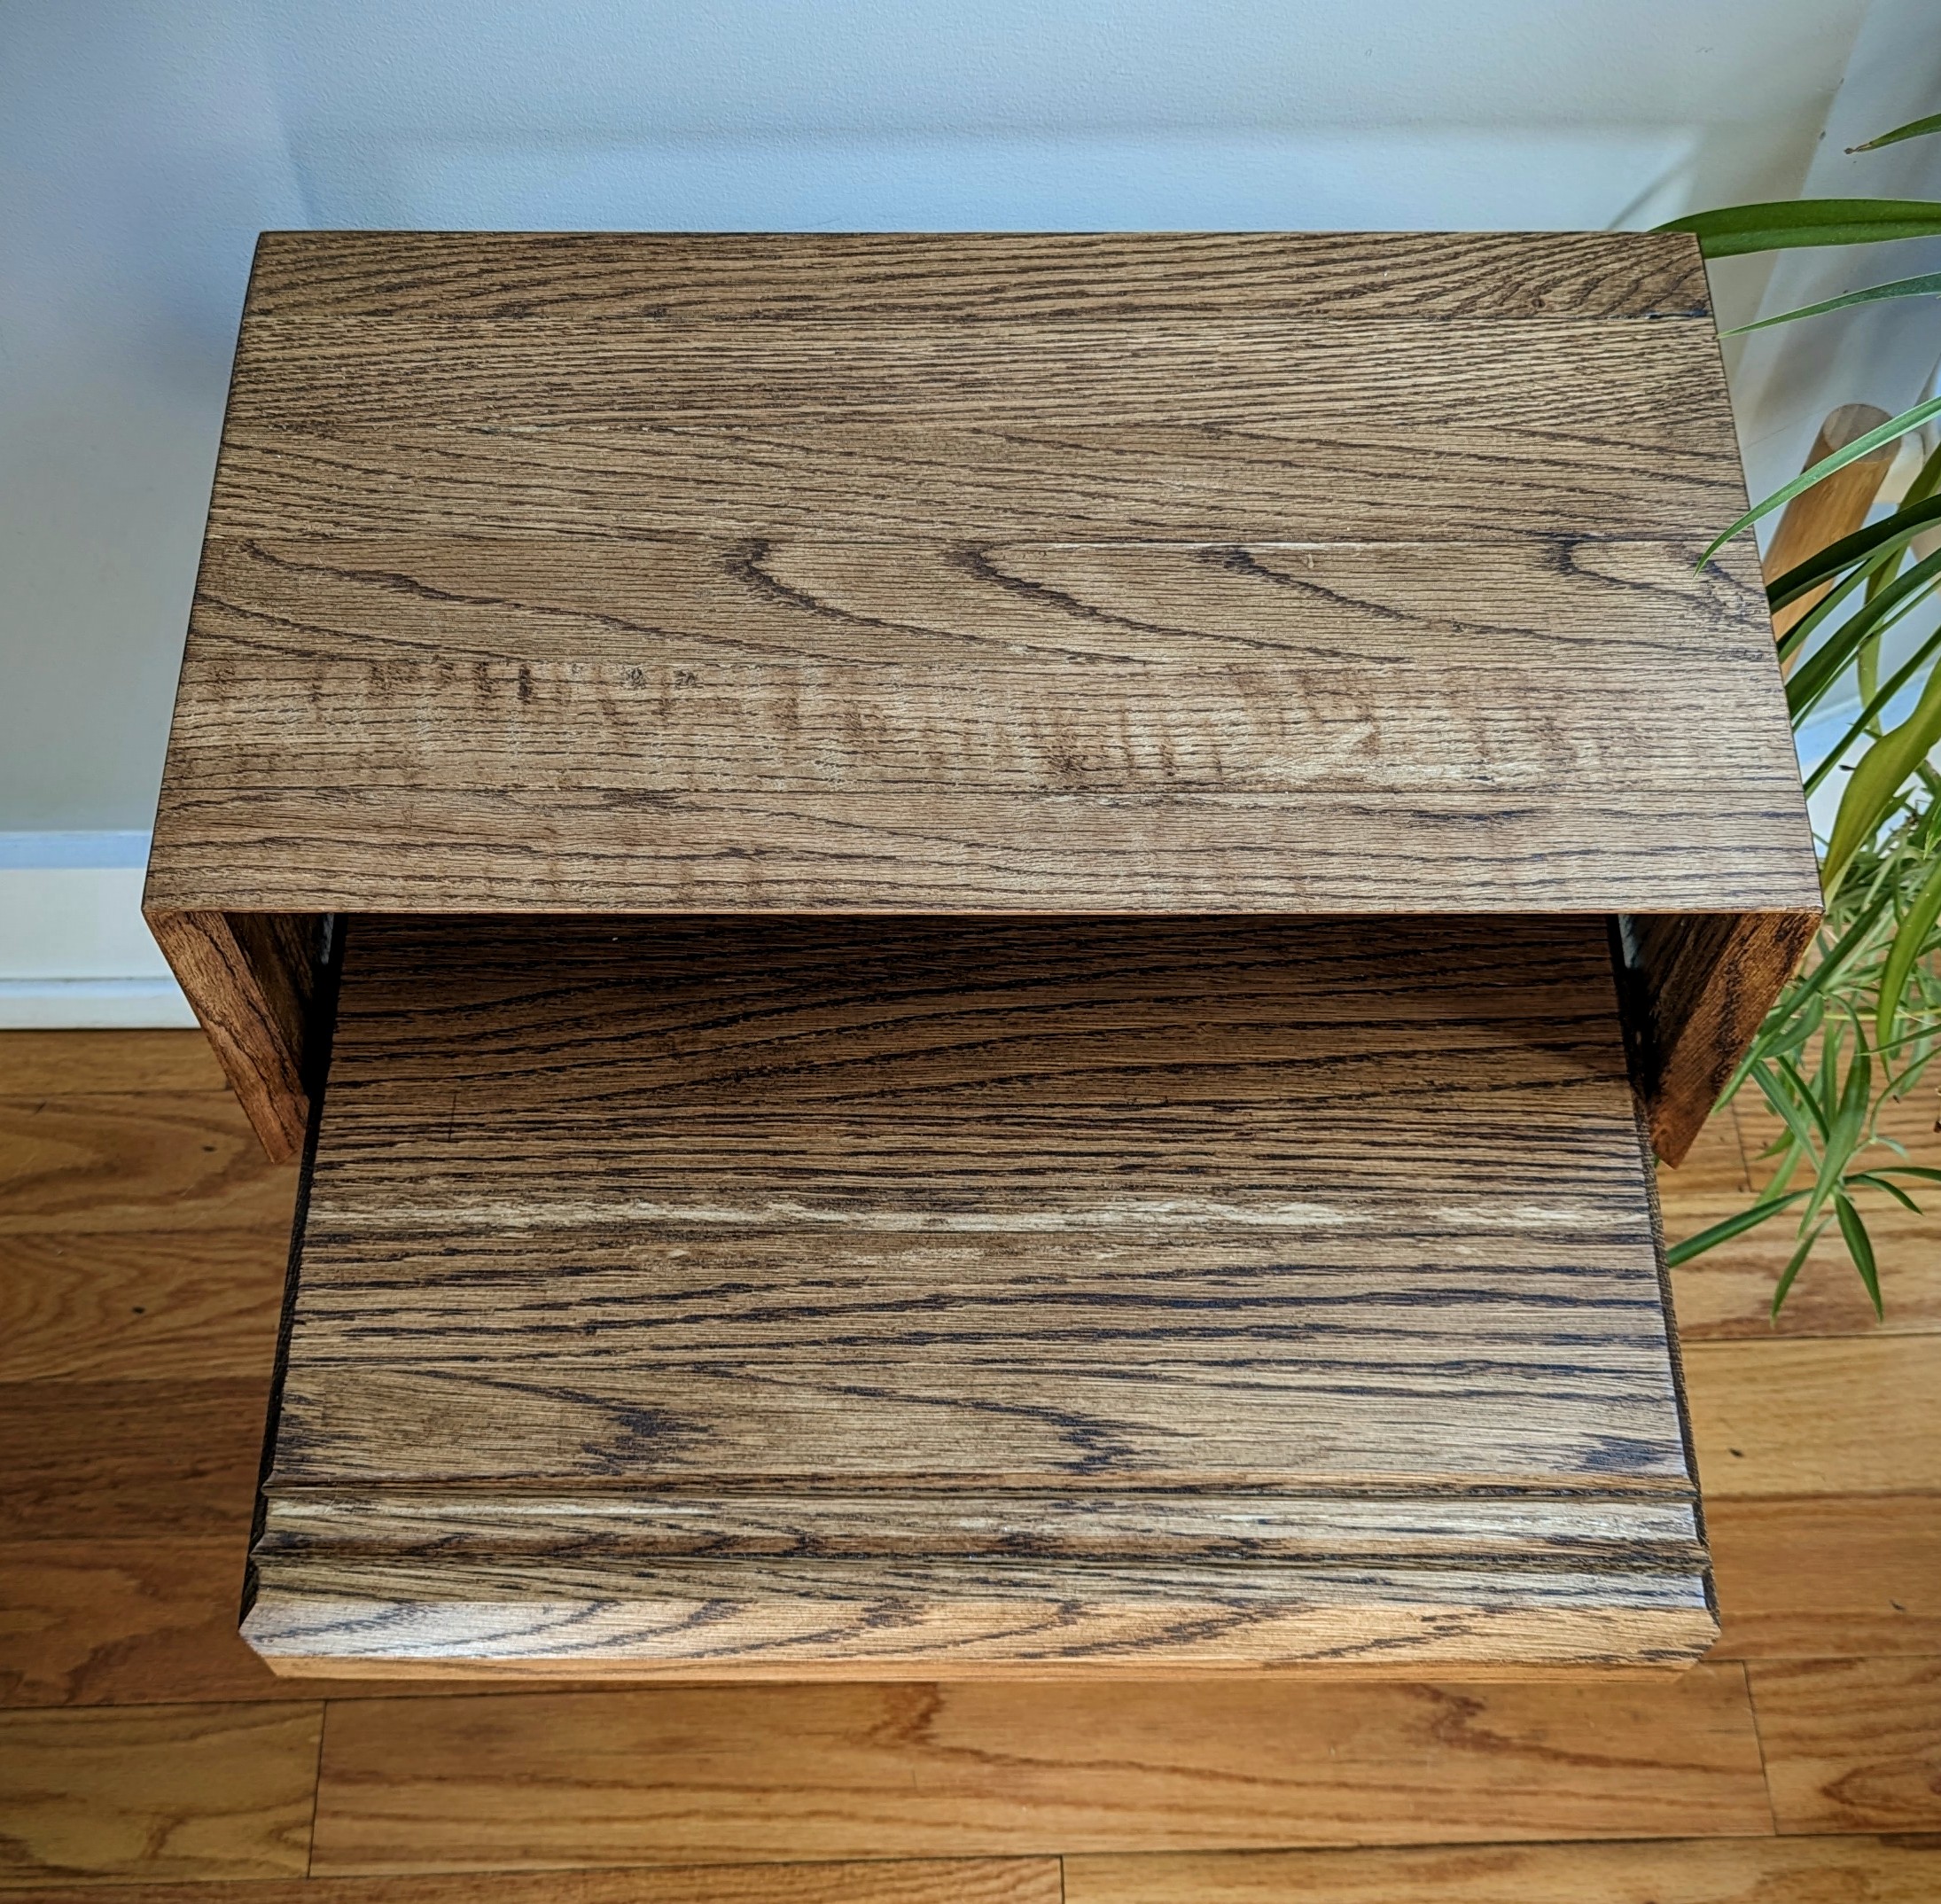
A weekend project to make myself I nice bedside table from some oak flooring scraps.
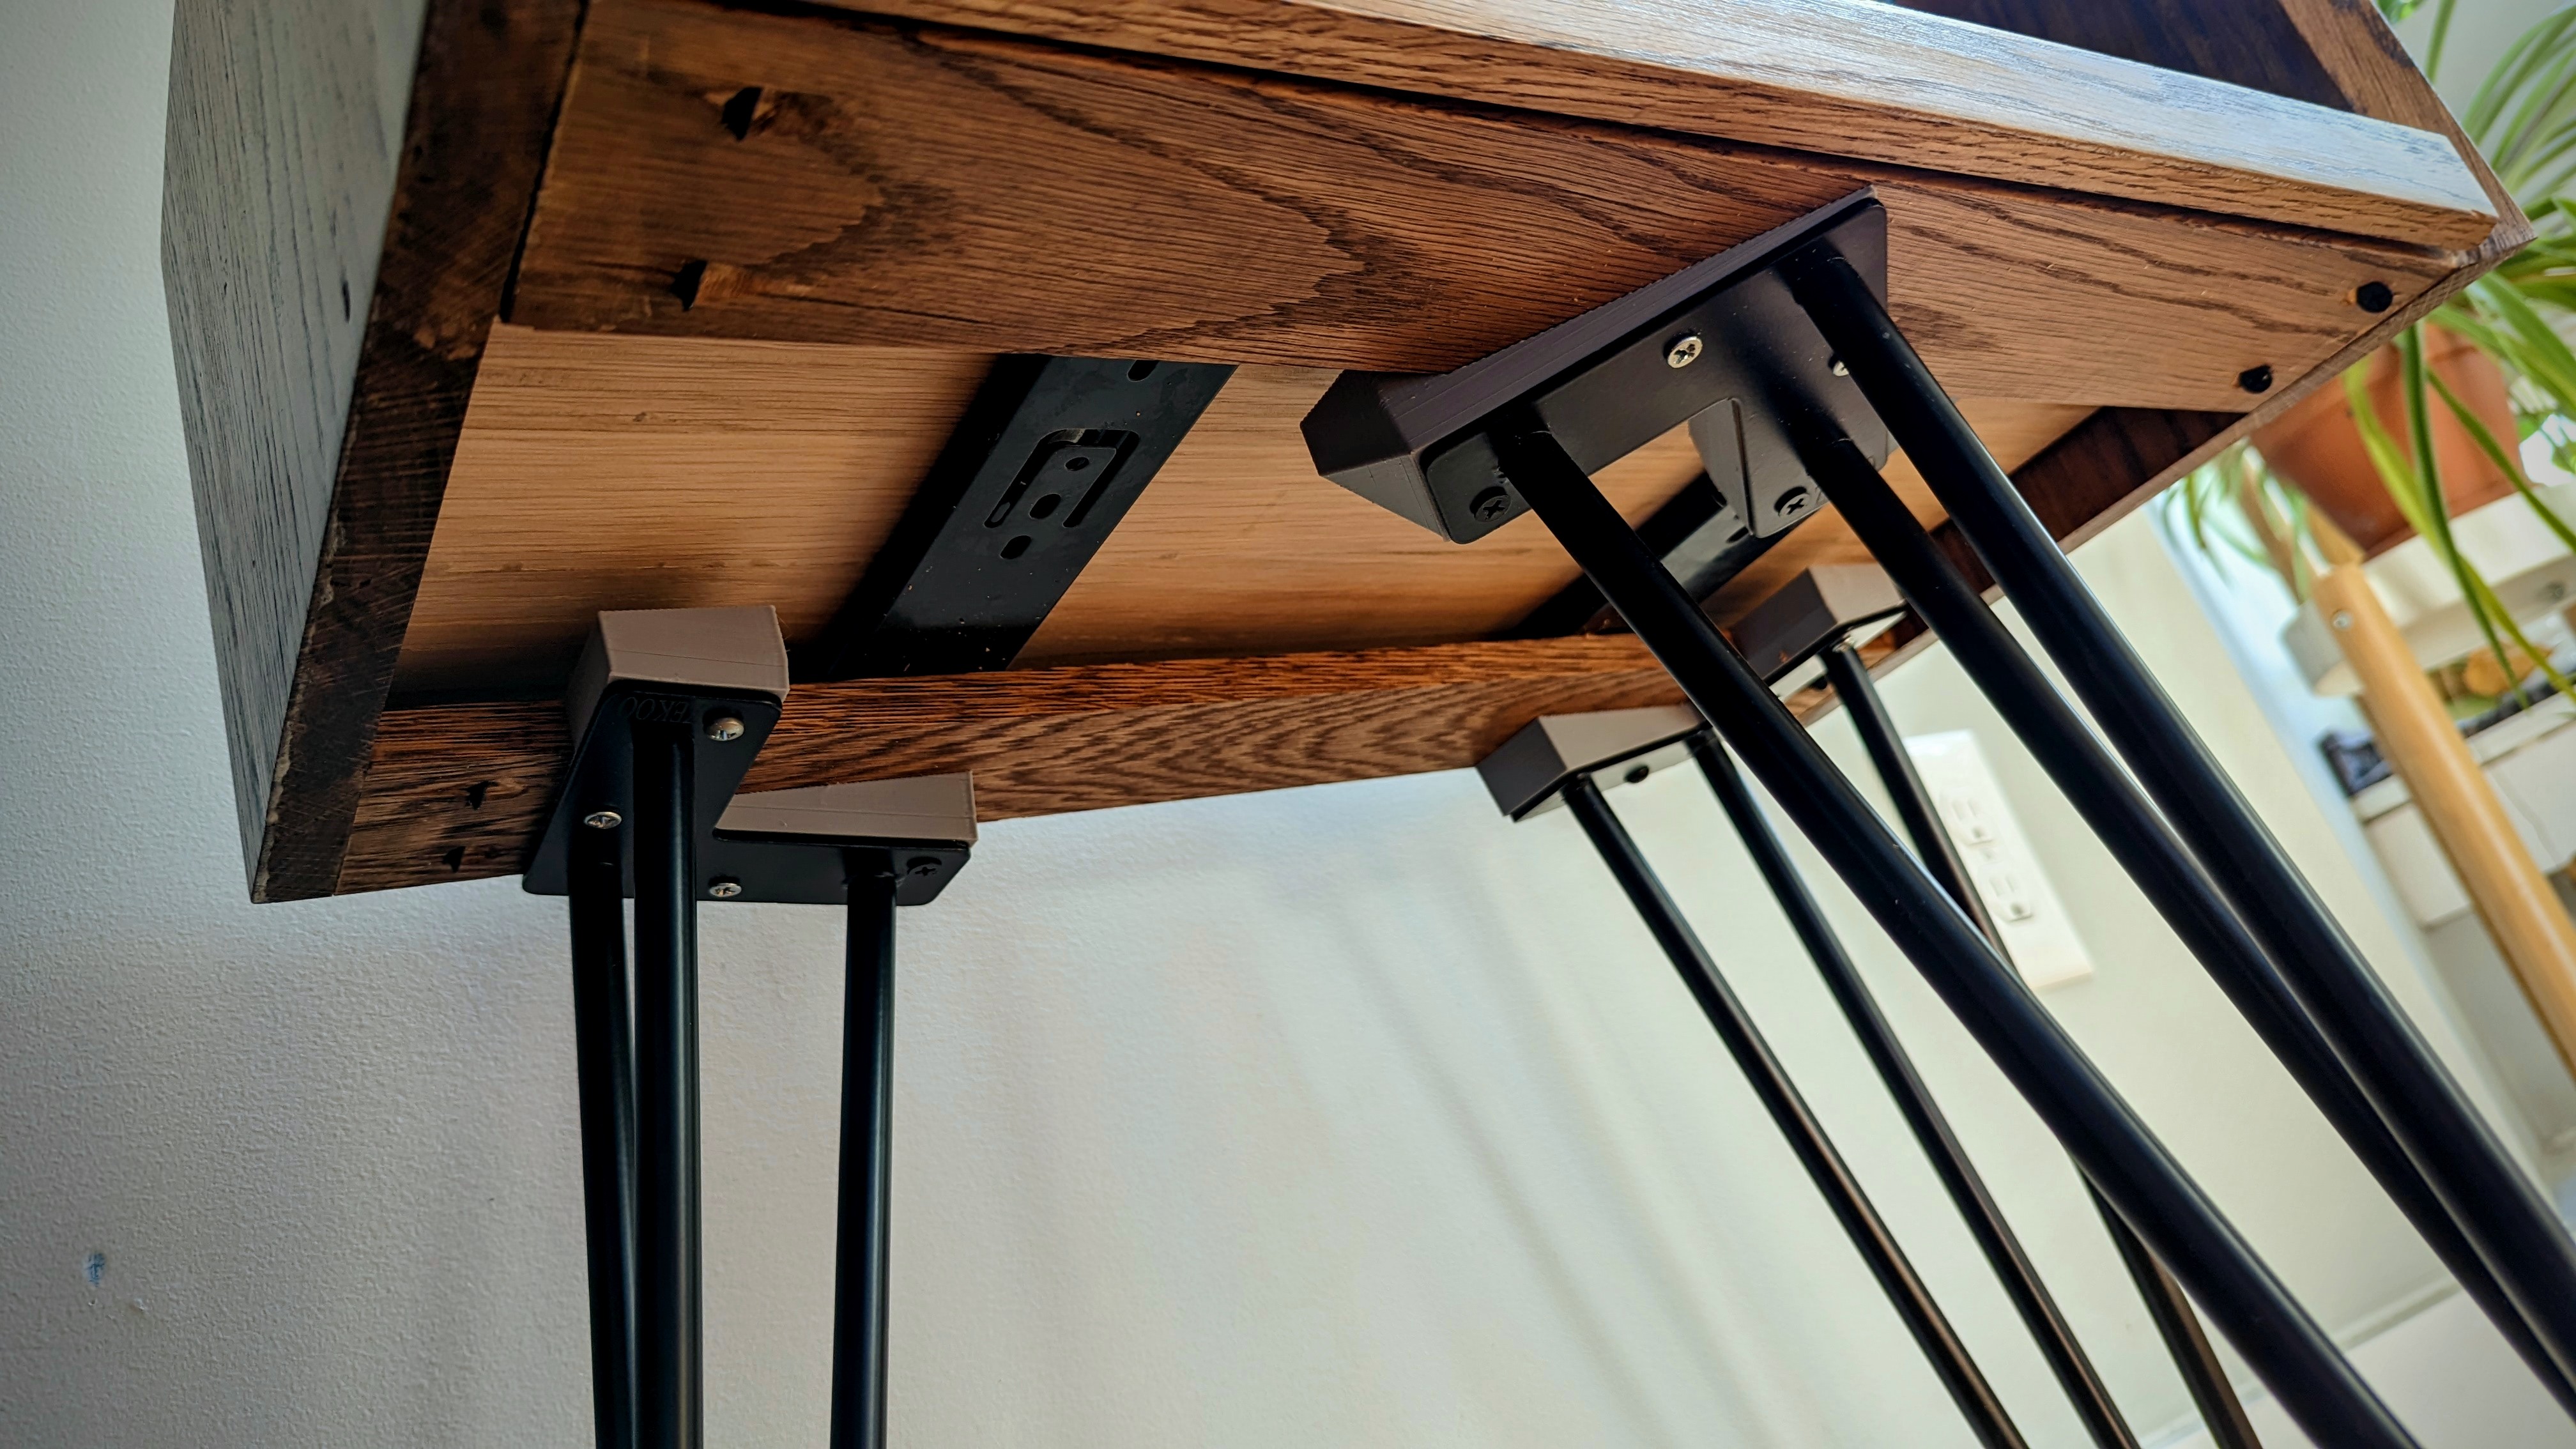
It has a shelf that pulls out, 3d printed brackets that angle the hair-pin legs in a nice way, and I'm really happy with the finish. Just oil, and I think I probably put a clear poly over it at the end.


At the time that I tried to carry out this project it was a huge struggle. I learned a ton about the various object detection models, writing custom models, layers and loss functions with TensorFlow and Keras, and also that it's sometimes better to use an off the shelf model than try to code it all yourself!
The goal of this project is to use a dataset of photographs to train a model to detect and identify an assorment of screws and nuts. The dataset was taken from the MVTec Screws Dataset. Object detection is a challenging problem in machinelearning and continues to be a very active area of research with new algorithms and processes being developed regularly.
The Dataset for this project consists of several hundred images of around 4500 thousand pieces of construction hardware belonging to 13 different classes. The mostly represent types of common screws however the images also contain nuts of varying sizes. Each size and type of hardware belongs to its own class.
The data is structured in a format similar to the COCO dataset standard. It is derived from a proprietary format belonging to the dataset originator, MVTec. The images are very standardized each depicting a different configuration of randomly assorted pieces of hardware. There is broadly no major class imbalance however individual images can contain anywhere from 10 to 20 parts of 5 to 10 classes.
The data presented several challenges when preparing it for training. The bounding-box format was similar to the COCO format but did not seem to match what most plug and play tool chains expected. This meant reworking the data multiple times and in a multitude of ways.
Data manipulation led to the writing of several custom tools to handle various aspects of preparing the data. These included:
For my final object detection attempt I used a YOLO implmentation written with Darknet. Darknet is a NN framework written in C and provides a python api and many versions of models with trained weights. I am using the YOLOv3 implementation in darknet and trained it using a set of weights from COCO and my own data.
It was relatively easy to set up and get training. There were small adjustments I need to make to my dataset and simple scripts to translate my labels to a format darknet will accept. In order to use this framework I removed the angle parameter from the labels and recalculated the points to match what darknet expects.
Although this project has been difficutl to get into a strong place performance-wise I am extremely satisfied with the progress and expreince I have gotten while working towards its completion. There is still a little ways to go, but I am excited to bring the knowledge and skills I have learned thus far to tackling the final stretch. The idosyncracies in the dataset have comlicated most of my attempts at finding the solution with the straightest path to completion, but thanks to that process I feel that I have gained real experience and knowledge in an area of machine-learning that I am deeply interested in pursuing further.
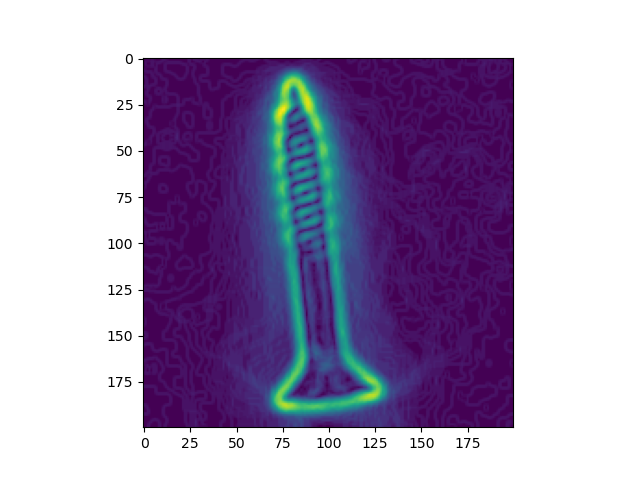
This was my first dive in the world of Autoencoders. The model I ended up with used a attempted to detect manufacturing defects in phots of screws with a Encoder/Decoder network.
I didn't really know what I was doing, but this experience would be very helpful when I moved on to object detections models that use deep u-nets like YOLO.
This is the github repo for my project on Anomaly Detection. I used a dataset of some ~500 images of screws to train a neural network and identify anomalous (damaged) screws in the test set.
The purpose of this project is to look for ways to improve or automate quality control procedures in industrial manufacturing. The idea is to train a model to identify damaged or faulty products, in this case screws, and remove them from the production line.
The dataset for this project was graciously provided by MVTec as part of their Anomaly Detection image set.
The data is split into a training and test set, and sub categories within the test set representing the anomalous category of the image. This made it fairly easy to load up the data into a notebook and get going with various autoencoding strategies.
A visualization of the output from my first model is pictured below:

The first model was a simple autoencoder with a series of Dense layers that compressed the data from each image into a relatively tiny tensor and then attempted to reconstruct the original image from that compressed version. As you can see from the image above the model had difficulty abstracting the position of the screw in each image so the output images are blurry and distorted around the center point of the screws.
The final model ended up being a multilayered convolutional network. The layers did a better job of abstracting the orientation of the screw and its structure in the image.
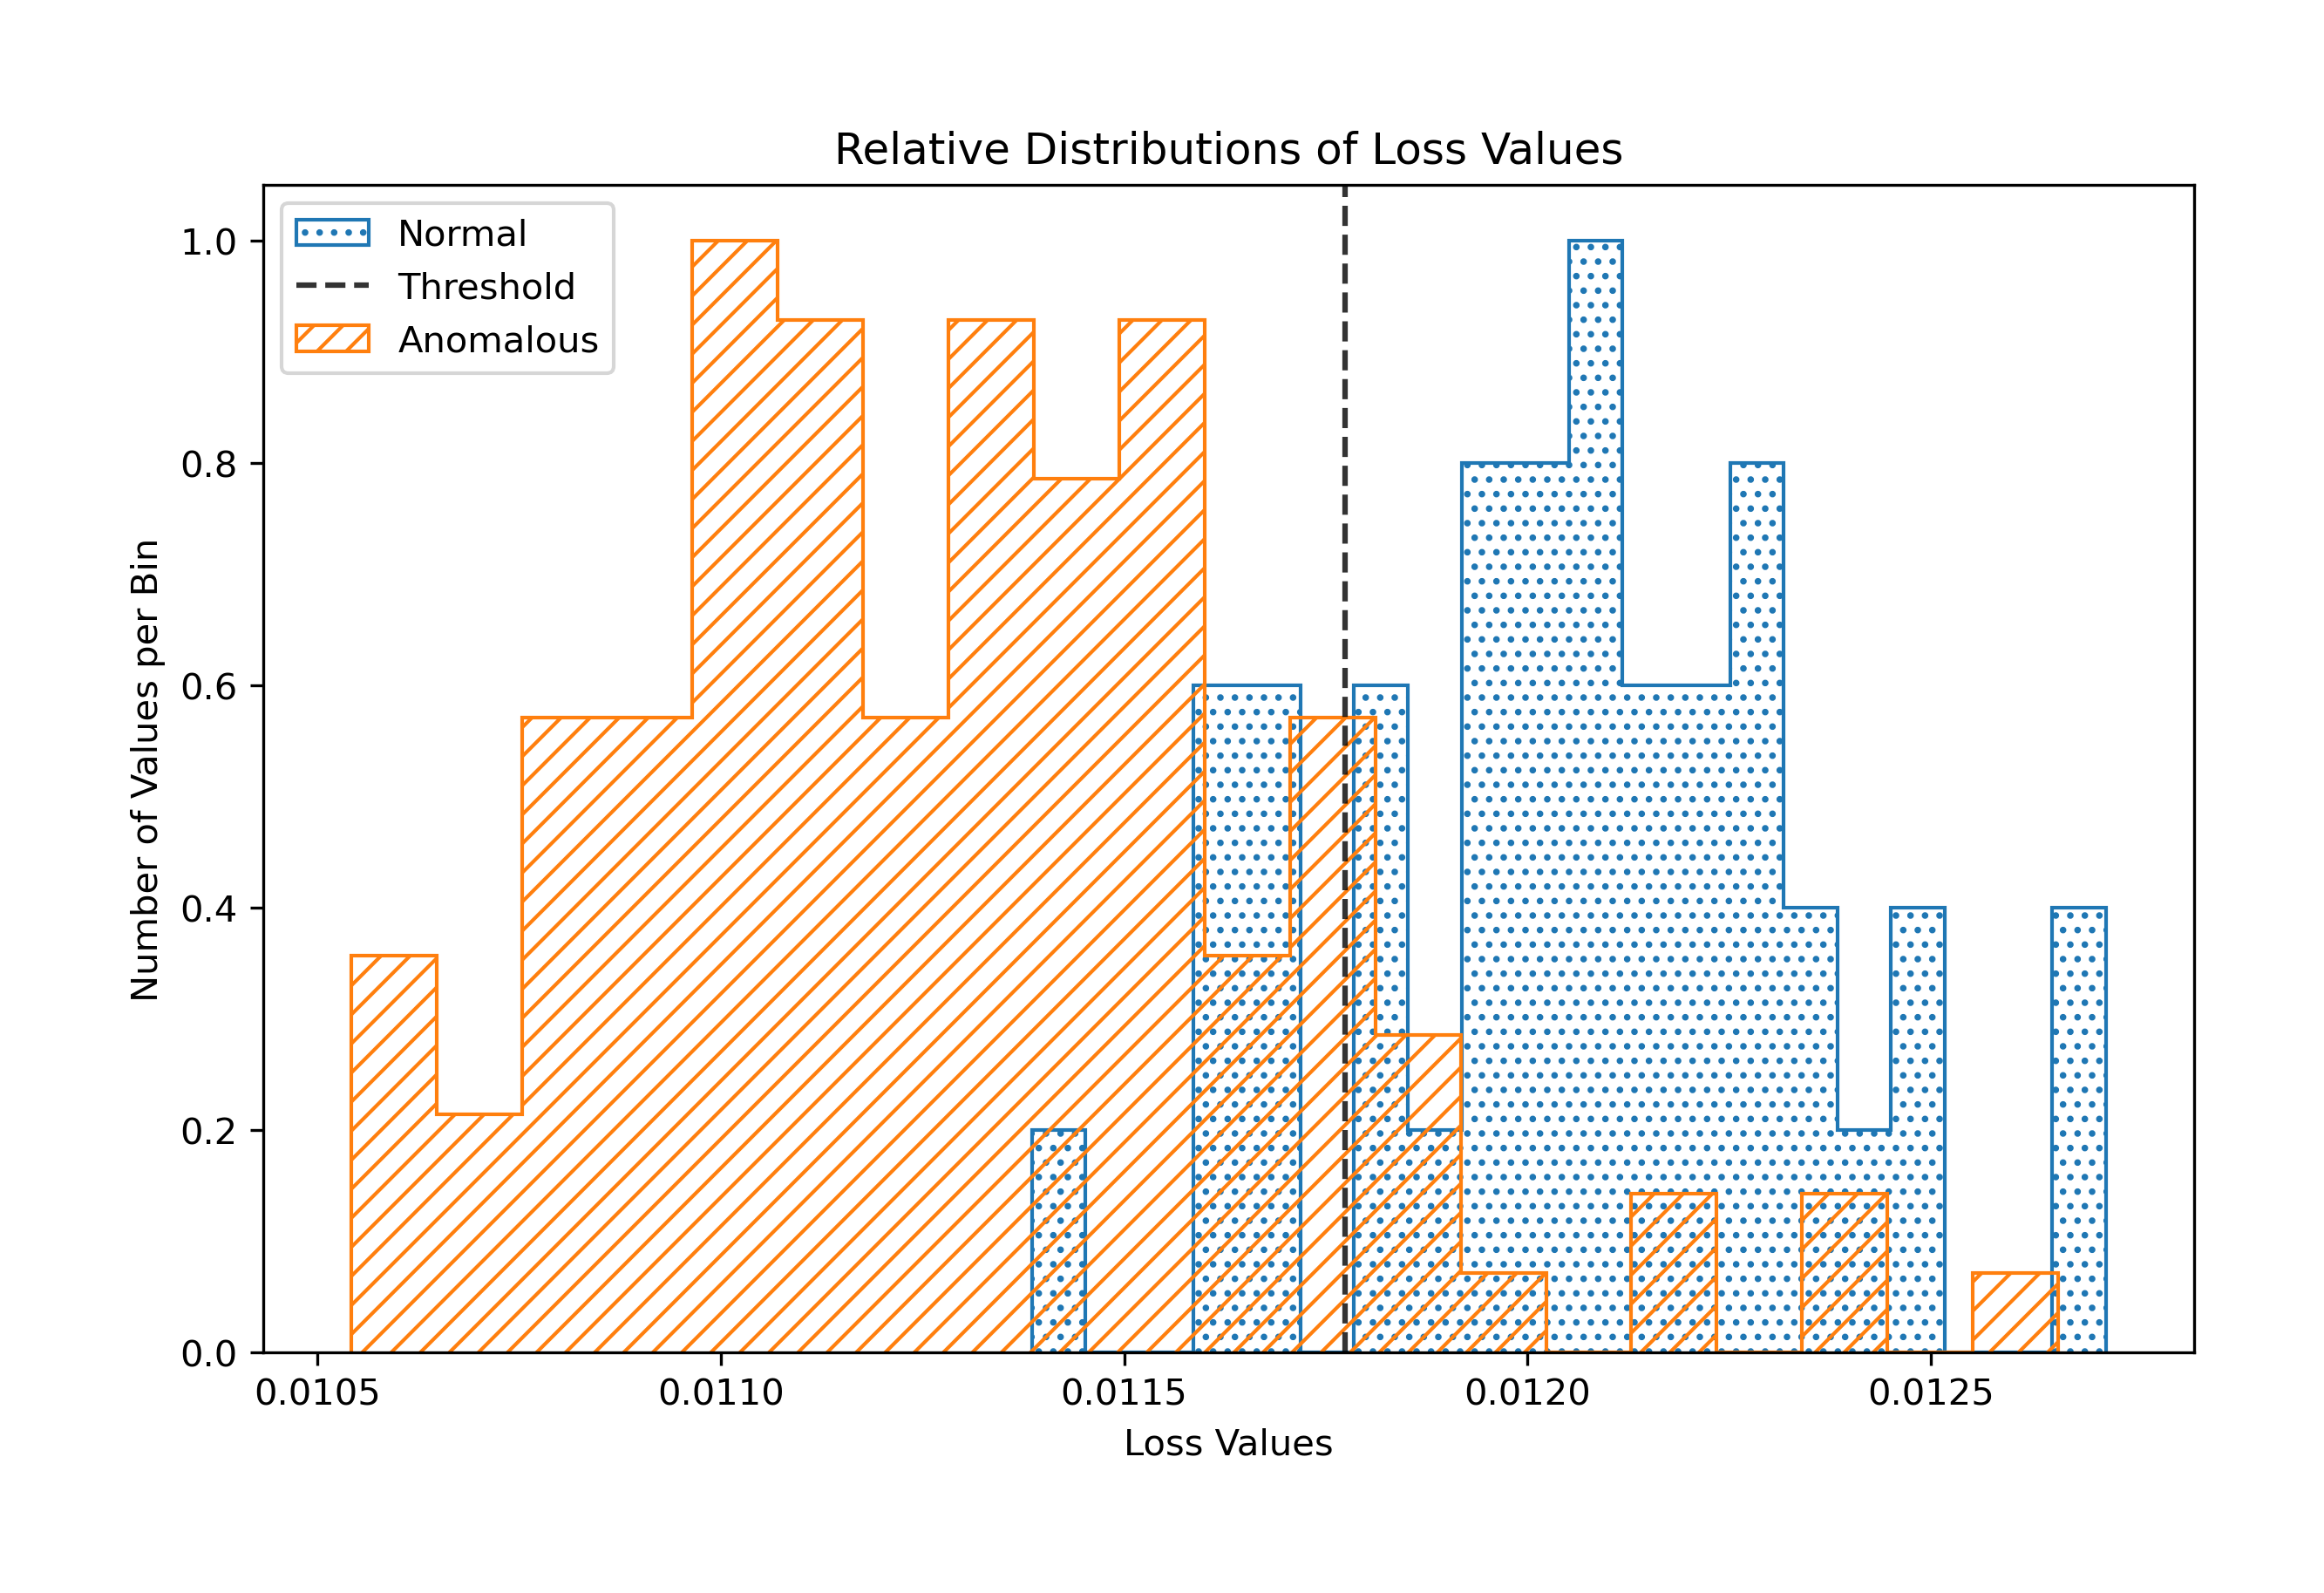
With this model I was able to achieve an average accuracy rating of 86% when it came to classifing anomalous screws. As you can see from the graph above once the model is trained I used the test set to measure the mean-square-error between the models inputs and outputs. This resulted in two loss distributions. A non-anomalous (normal) loss distribution and a loss distribution for anomalous input data.
Using these distributions I calculated a classificatoin threshold and then programmed a function to return the accuaracy rating of that threshold.
I am continuing to investigate ways of improving this process's accuracy and consistency. I am going to try different loss functions and see if applying different preprocessing methods like sobel filtering or other simple convolutional functions could improve performance, and focus the model on specific features.
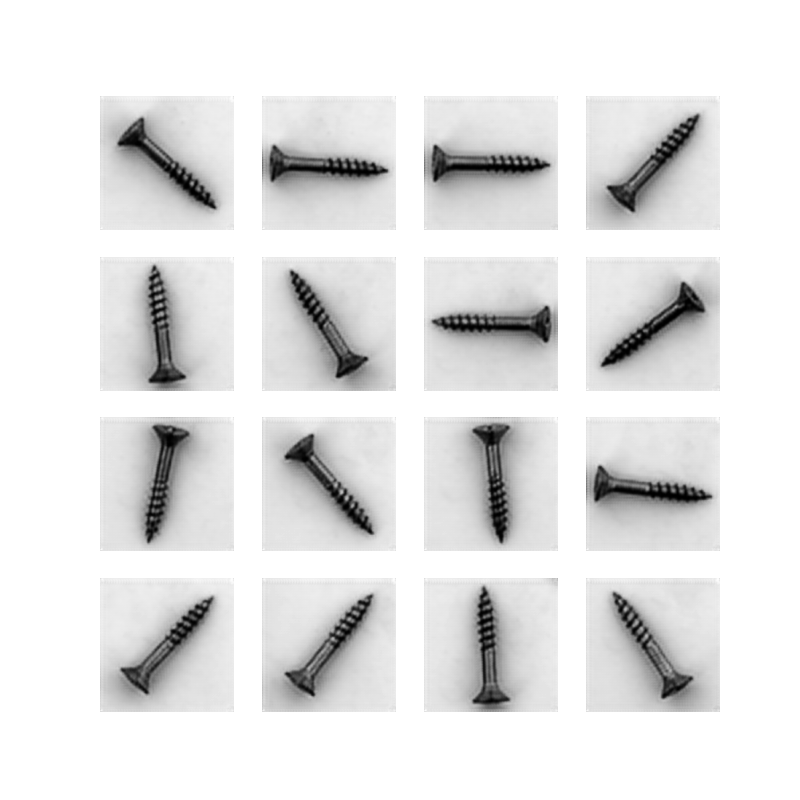
Markus Ulrich, Patrick Follmann, Jan-Hendrik Neudeck: A comparison of shape-based matching with deep-learning-based object detection; in: Technisches Messen, 2019, DOI: 10.1515/teme-2019-0076.

This was a really fun project to work on and involved time-series data collected from sensors on a hydraulic pump rig. I got experience writing algorithms to programmatically tune model parameters, evaluate various methods of analyzing the time-series, and formatting outputs for human readability.
This data comes from a set of sensor measurements taken during 2205 sixty second cycles of a hydraulic pump testing rig. During the testing the pump's maintenance status was recorded. These various metrics of the test rigs physical condition will be the target variable for our tests. The sensor data will be the predictors.
The goal will be to use sensor data (such as temperature, tank pressure, vibration magnitude, etc.) to predict the state of the hydraulic pump.
The data is split between sensors. Each sensor has a specific sample rate qhich cooresponds to the columns in its table. So TS1.txt contains temprature readings from one sensor. Its sample rate was 1hz for each 60 second pump cycle. Therefore, in the TS1.txt file there are 60 columns and 2205 rows of data.
Each row represents one full cycle and each column represents one sample (in this case 1 second) of readings from the temperatue sensor. To create features from this data we will need to come up with methods for aggregating each row of the sensor data into a single column of data.
As previously mentioned, the data set includes five target variables – cooler condition, valve condition, internal pump leakage, hydraulic accumulator (hydraulic pressure), and stable flag (stable condition). We determined that each of these target variables were vital to the stakeholder and will likely impact our final recommendation. As a result, several models were created. About two models were created for each target variable. Depending on the variable, utilized, certain features were utilized including simple averages of the 60-second cycle, the average change over the course of the cycle, the average and change every 20-seconds of the cycle, and standard deviation of both the full 60-second cycle and every 20-seconds. To begin, we will utilize a simple logistic regression model. Given the data and the stakeholder’s business problem, it will make most sense to run a grid search on several different model types to determine which produces the highest accuracy.
For our first model, we are utilizing the grid search to evaluate the Valve Condition as our target variable and utilizing the average metrics of each cycle (simple average) as our feature. To begin, we will evaluate five different models – a logistic regression model, a decision tree model, a random forest model, a K-nearest neighbors (KNN) model, a support vector machine model, and an XGBoost model. We will run a grid search for each of these models to evaluate the hyperparameters that will produce the highest accuracy scores. As a reminder, Valve Condition, measured as a percentage, includes four classifications – 100 meaning the pump was functioning at optimal switching behavior, 90 meaning there was a small lag, 80 meaning there was a severe lag, and 73 meaning the pump was close to total failure.
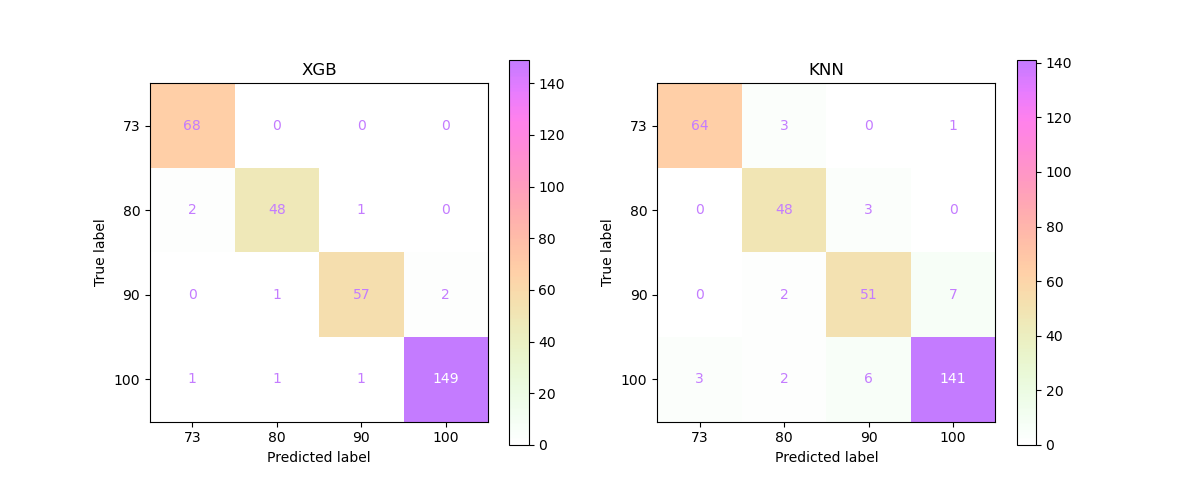
After running all of the above models and inspecting their output we determined that XGBoost was the best model to iterate one more time. We were also able to determine which feature/target pairings resulted in the best predictions.
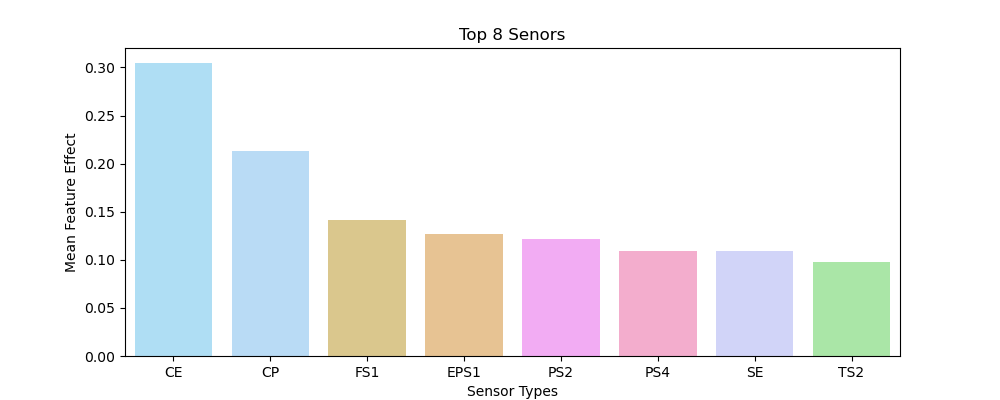
Below we set up test to see which of the sensors had the best feature importance on average. A series of functions in helpers.py were chained along with some search and result parsing to allow us to extract the relevant statistics.
Below are the 8 top performing sensors in predicting the state of the hydraulic pump test rig.
Below we have the metrics from our final models.

We decided to go with the XGBoost model for our final iteration and Average of cycle thirds as the feature set for each target variable except Cooler Condition. For Cooler Condition we decided to use the Standard Deviation for Cycle 3rds as the feature. This was due to its consistently high score along all our metric axes.
Considering all of the above analysis we would recommend the stakeholder utilize an XGBoost predictive model. According to the numerous models and iterations we ran, the best, most accurate model the stakeholder should utilize is an XGBoost model. Further, to effectively utilize this model, we would recommend utilizing the model to predict a pump’s cooler condition and internal pump leakage. Based on our analysis, these predictive models generated the highest accuracy scores (99%+). While the accuracy score of these models are high, there are reasons the model may not fully solve the business problem. The data we utilized was ultimately collected from a single test rig, meaning the environment in which this test rig was producing the data analyzed was carefully selected by the test coordinators. Therefore, there could have been situations that caused leaks or other faults with the pumps that were not accounted for, such as human error or other extreme situations.
Further criteria and analyses could yield additional insights to further inform the stakeholder by:
Reviewing other testing data. The stakeholder should consider utilizing a data set in addition to the one that was analyzed. As previously mentioned, although the data set included 2200+ records of testing data, this data was collected from a single test rig. Utilizing data from another test rig could be helpful with re-checking the accuracy of our final model and noting if our findings were consistent.
Collecting real-word data. Another factor the stakeholder should consider is collecting real-world data. It is known that the stakeholder uses specific water pumps with their irrigation systems. As such, the stakeholder should consider setting up a system to collect daily data similar to that of the data set utilized. By doing so, the stakeholder could utilize the final model with the data processed through their irrigation system.
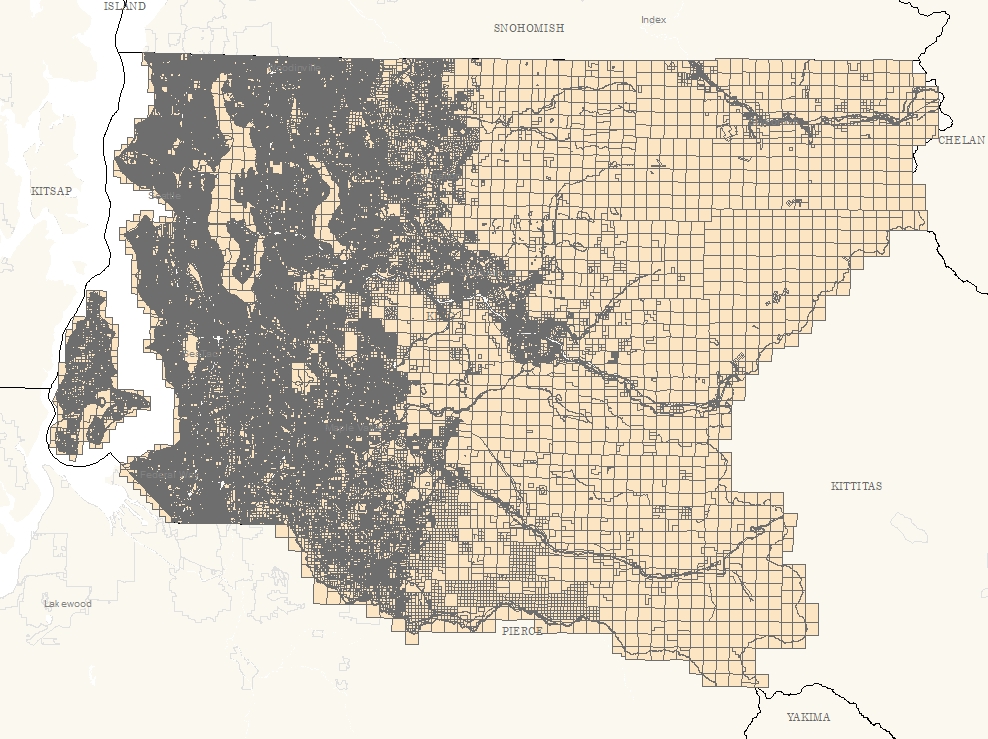 The King County Parcel Map
My second data science project where I joined a real estate dataset with data from the census to analyze investment opportunities in the Seattle area.
Stretching the project to include census data allowed me to get experience building workflows that incorporate multiple datasets with differing formats and features.
The client is an NGO based in the Seattle area working in community outreach and development. They are interested in gaining deeper insight into the communities in and around King County with the hopes of better focusing investment for maximum impact.
The NGO board has identified Life Expectancy as a primary metric to locate and understands areas around the county that require investment. Further, they are interested in local property markets as an indicator of communities general economic health and as a indicator for the effect size they can expect their investments to have on those communities.
To investigate this topic I used a primary dataset collected by the King County Assessors office, and one secondary dataset compiled as part of the Land Conservation Intiative (LCI) opportunity are analysis.
The Kings County Property Sales data was collected from 2014 through 2015.
The LCI dataset is a combination of several datasets from Public Health, the American Communities Survey, and localization data as part of King County's Open Data program. The date range on the data combined in this set are 2014 - 2019.
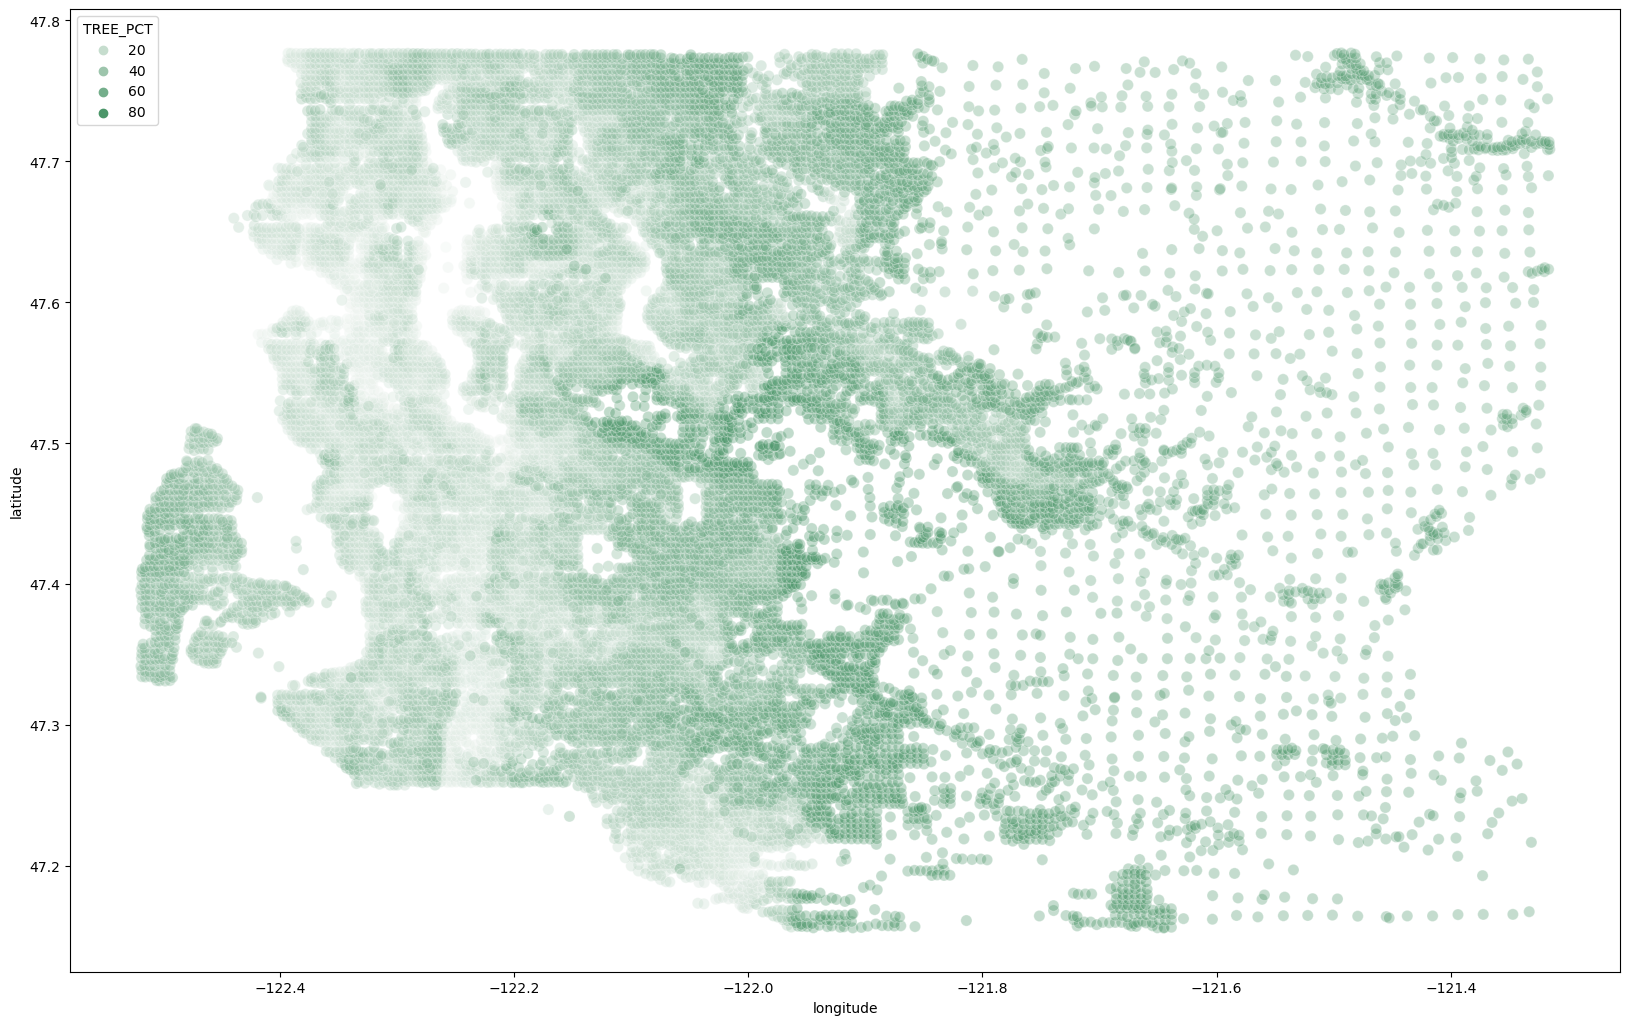 King County Tree Cover
Percentage
The first thing I want to do is identify data types and start to parse out how things are related. in This section I will discuss the ways that I appraoched this. The parts that worked and the parts that didn't.
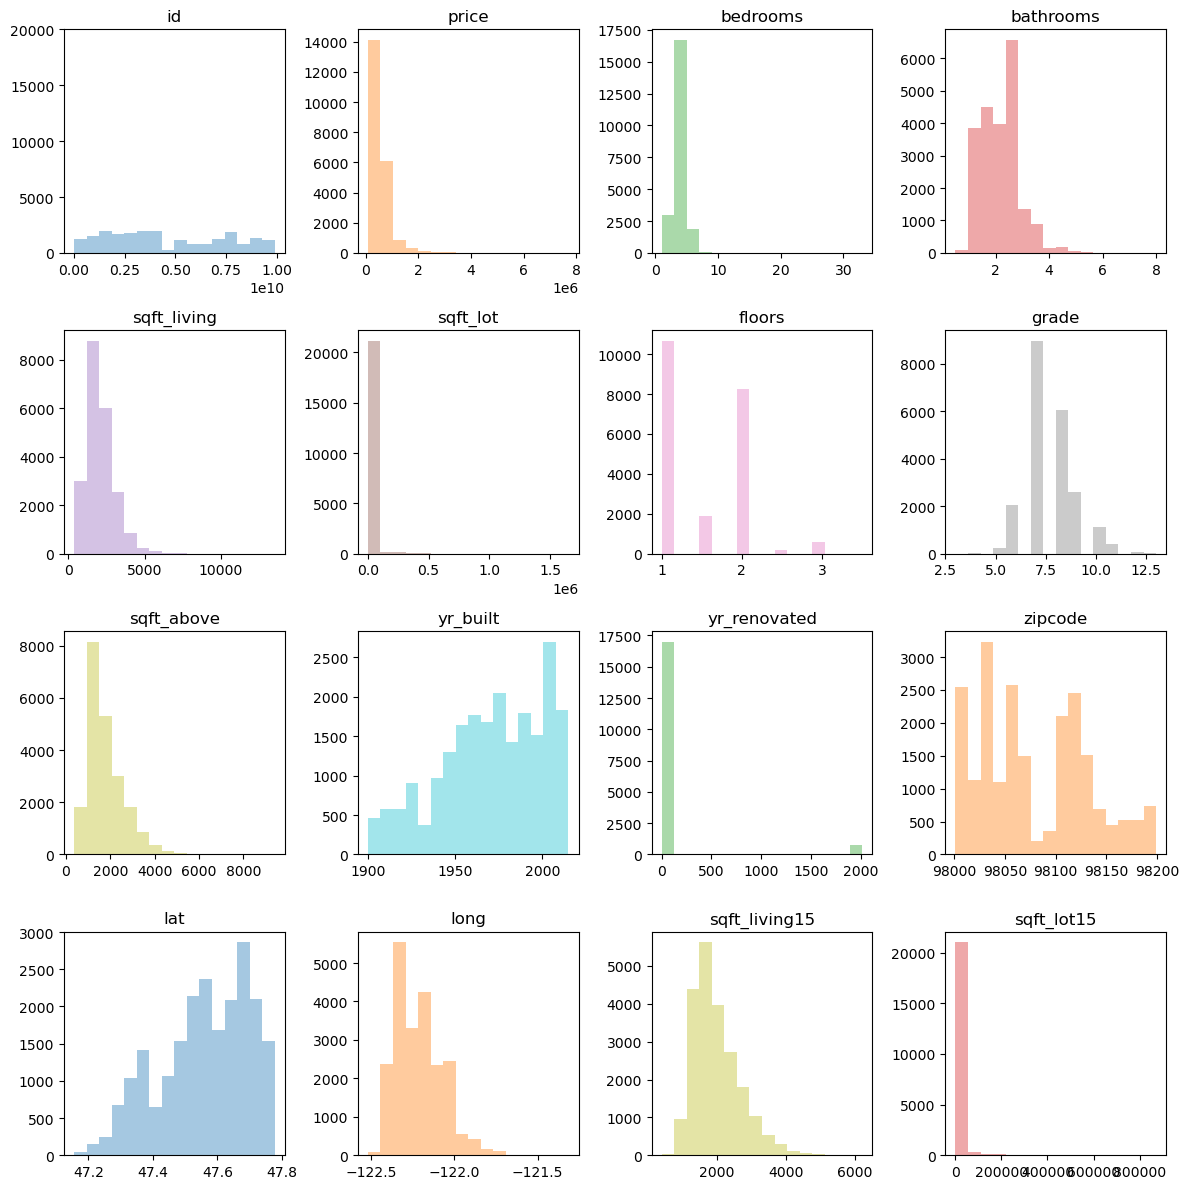
Below is a little bit of the process I used to take care of outliers. it resulted in a much more normal distribution for most of the numerical categories. I wasted most of today investigating the the sqft_lot and sqft_lot15 columns and why they are retaining so much skew after normalization.
I want to figure out how to take something like a derivative of the distribution to test how the features are actually structured. Made some progress toward that but it is now 2am.

A simple project with a well known public dataset to get my feet wet in data science. I used python/pandas for the exploratory step and statistical analysis.
This project was a self directed EDA and data processing project using the Python Pandas library and a collection of datasets from IMDB (the Internet Movie Database) and a few other similar sources. The Intention of the project is to discover, analyze and use patterns and relationships found in the provided datasets to make business recommendations according to the following prompt.
The client, Microsoft, has decided to explore getting involved in the entertainment industry. Specifically, they are interested in making movies. I have been task with examining the provided data and making three recommendations for how to successfully enter the entertainment industry as a large, established company currently operating in a different industry.
Some questions I attempted to answer with this dataset were: * What types of movies are succesful in today's market * What patterns and trends can be gleaned from the dataset * Given the observable business environment, what practical advice would I provide a client about entering the industry
The source for the data used was a publicly licensed sql database provided by the website IMDB. The database contained 8 tables: table names
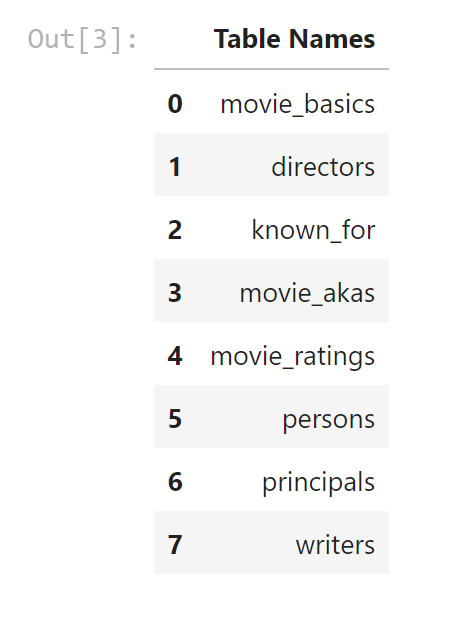
I started off the EDA process by pulling these table out of the sql database and storing them in Pandas DataFrame objects oragnized within a python dict object. I was then able to start observing the structure of and relationships between the tables and begin the process of analyzing there meaning.
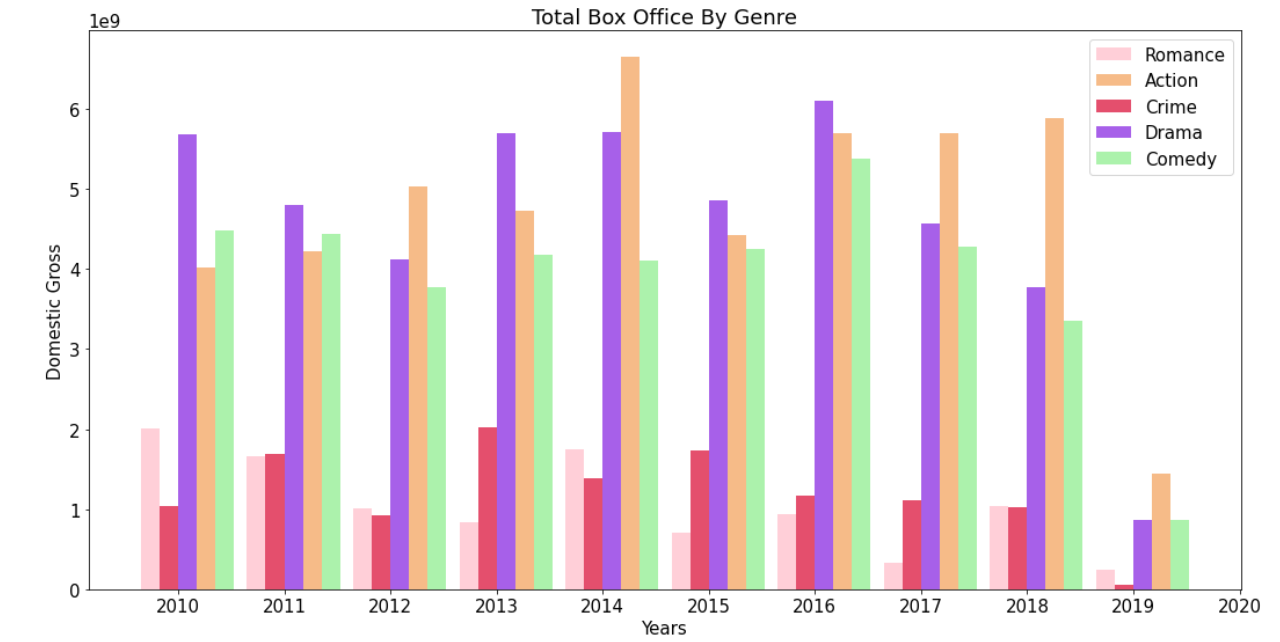
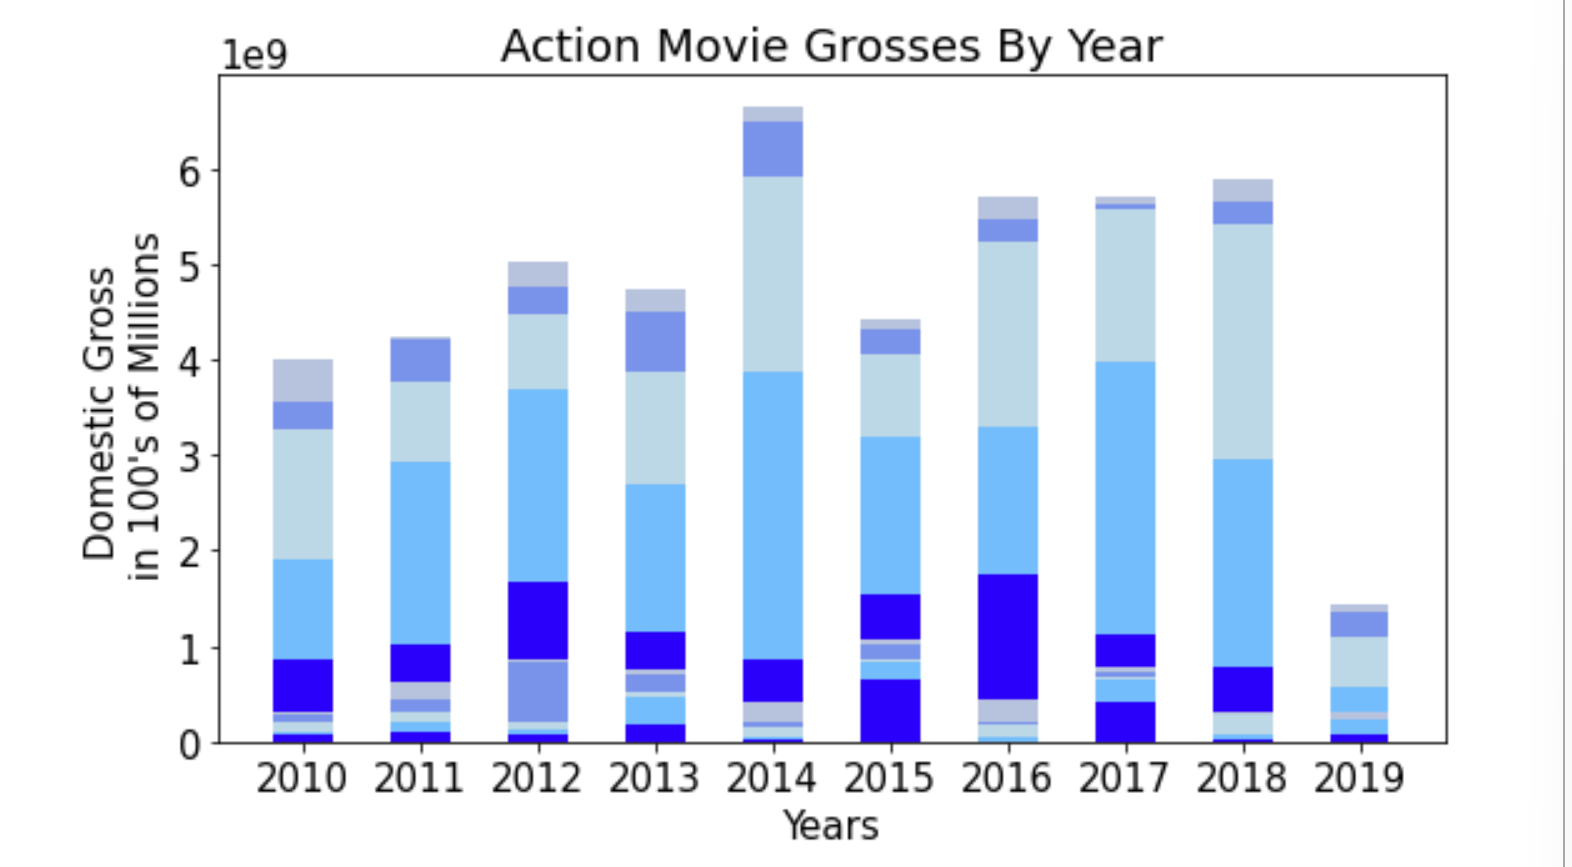
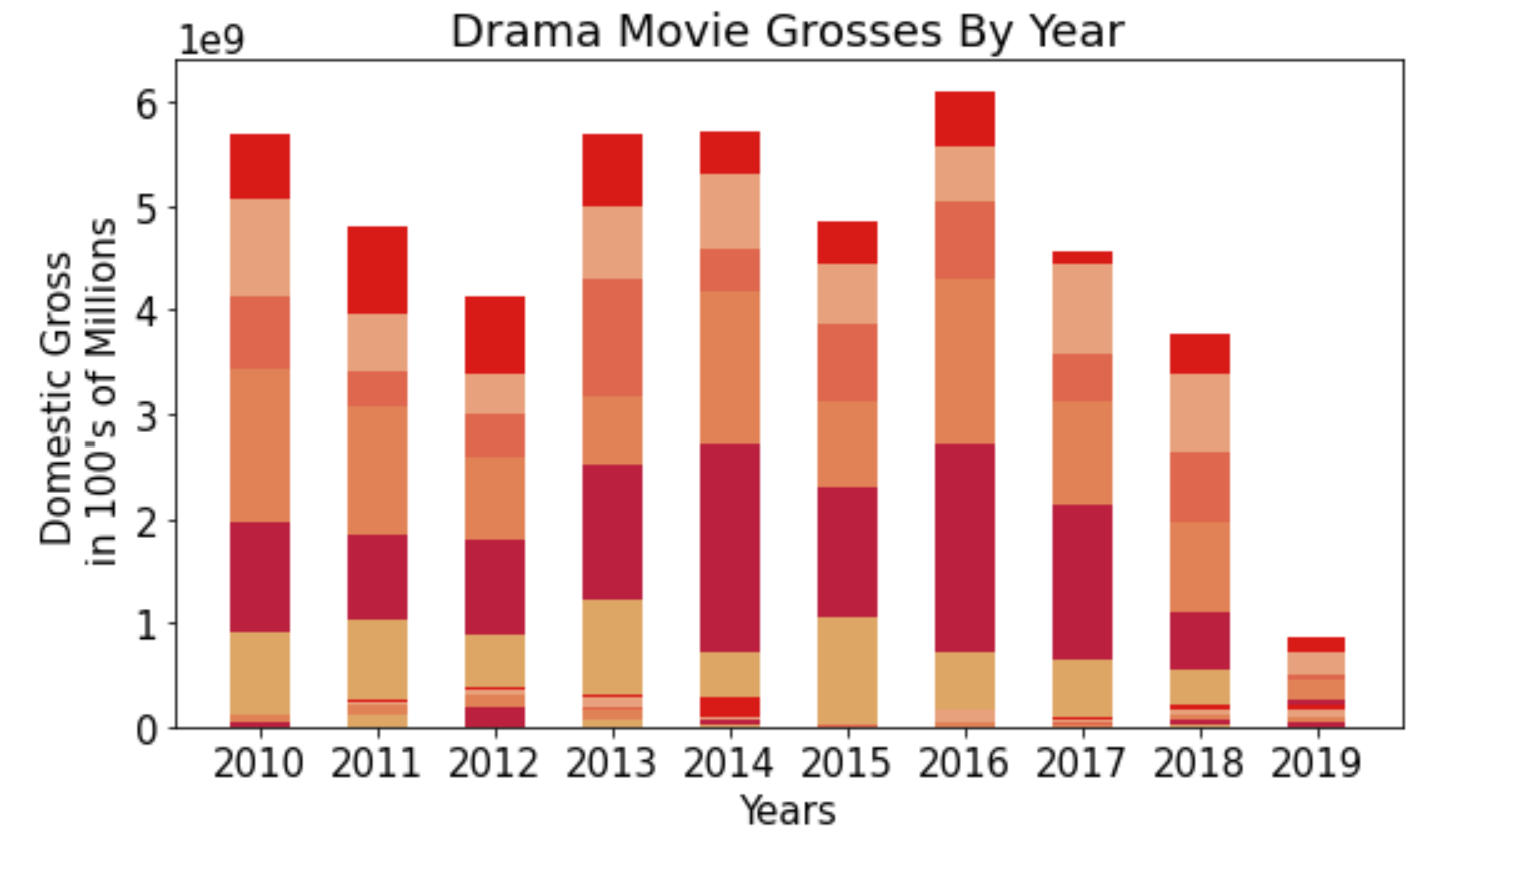
I started by visualizing the total box office grosses for each of the top genres.
Then I decided to compare the median production budget by each of these genres.
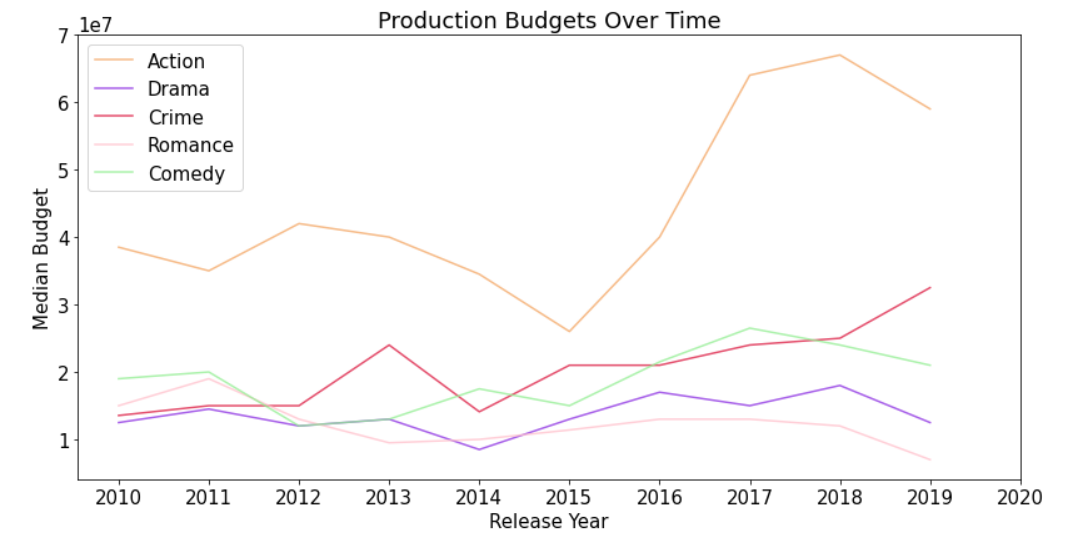
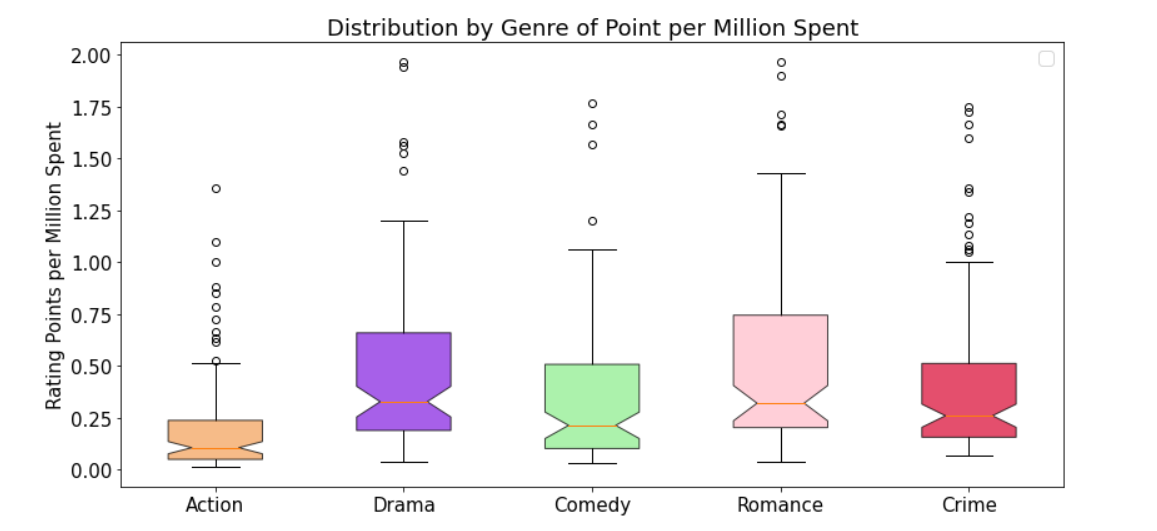
and the distribution within each genre of ratings vs budget:
After identifying that Action and Drama commanded the largest market share among the various genres, I wanted to compare the distribution of the that market share within each repsectively.
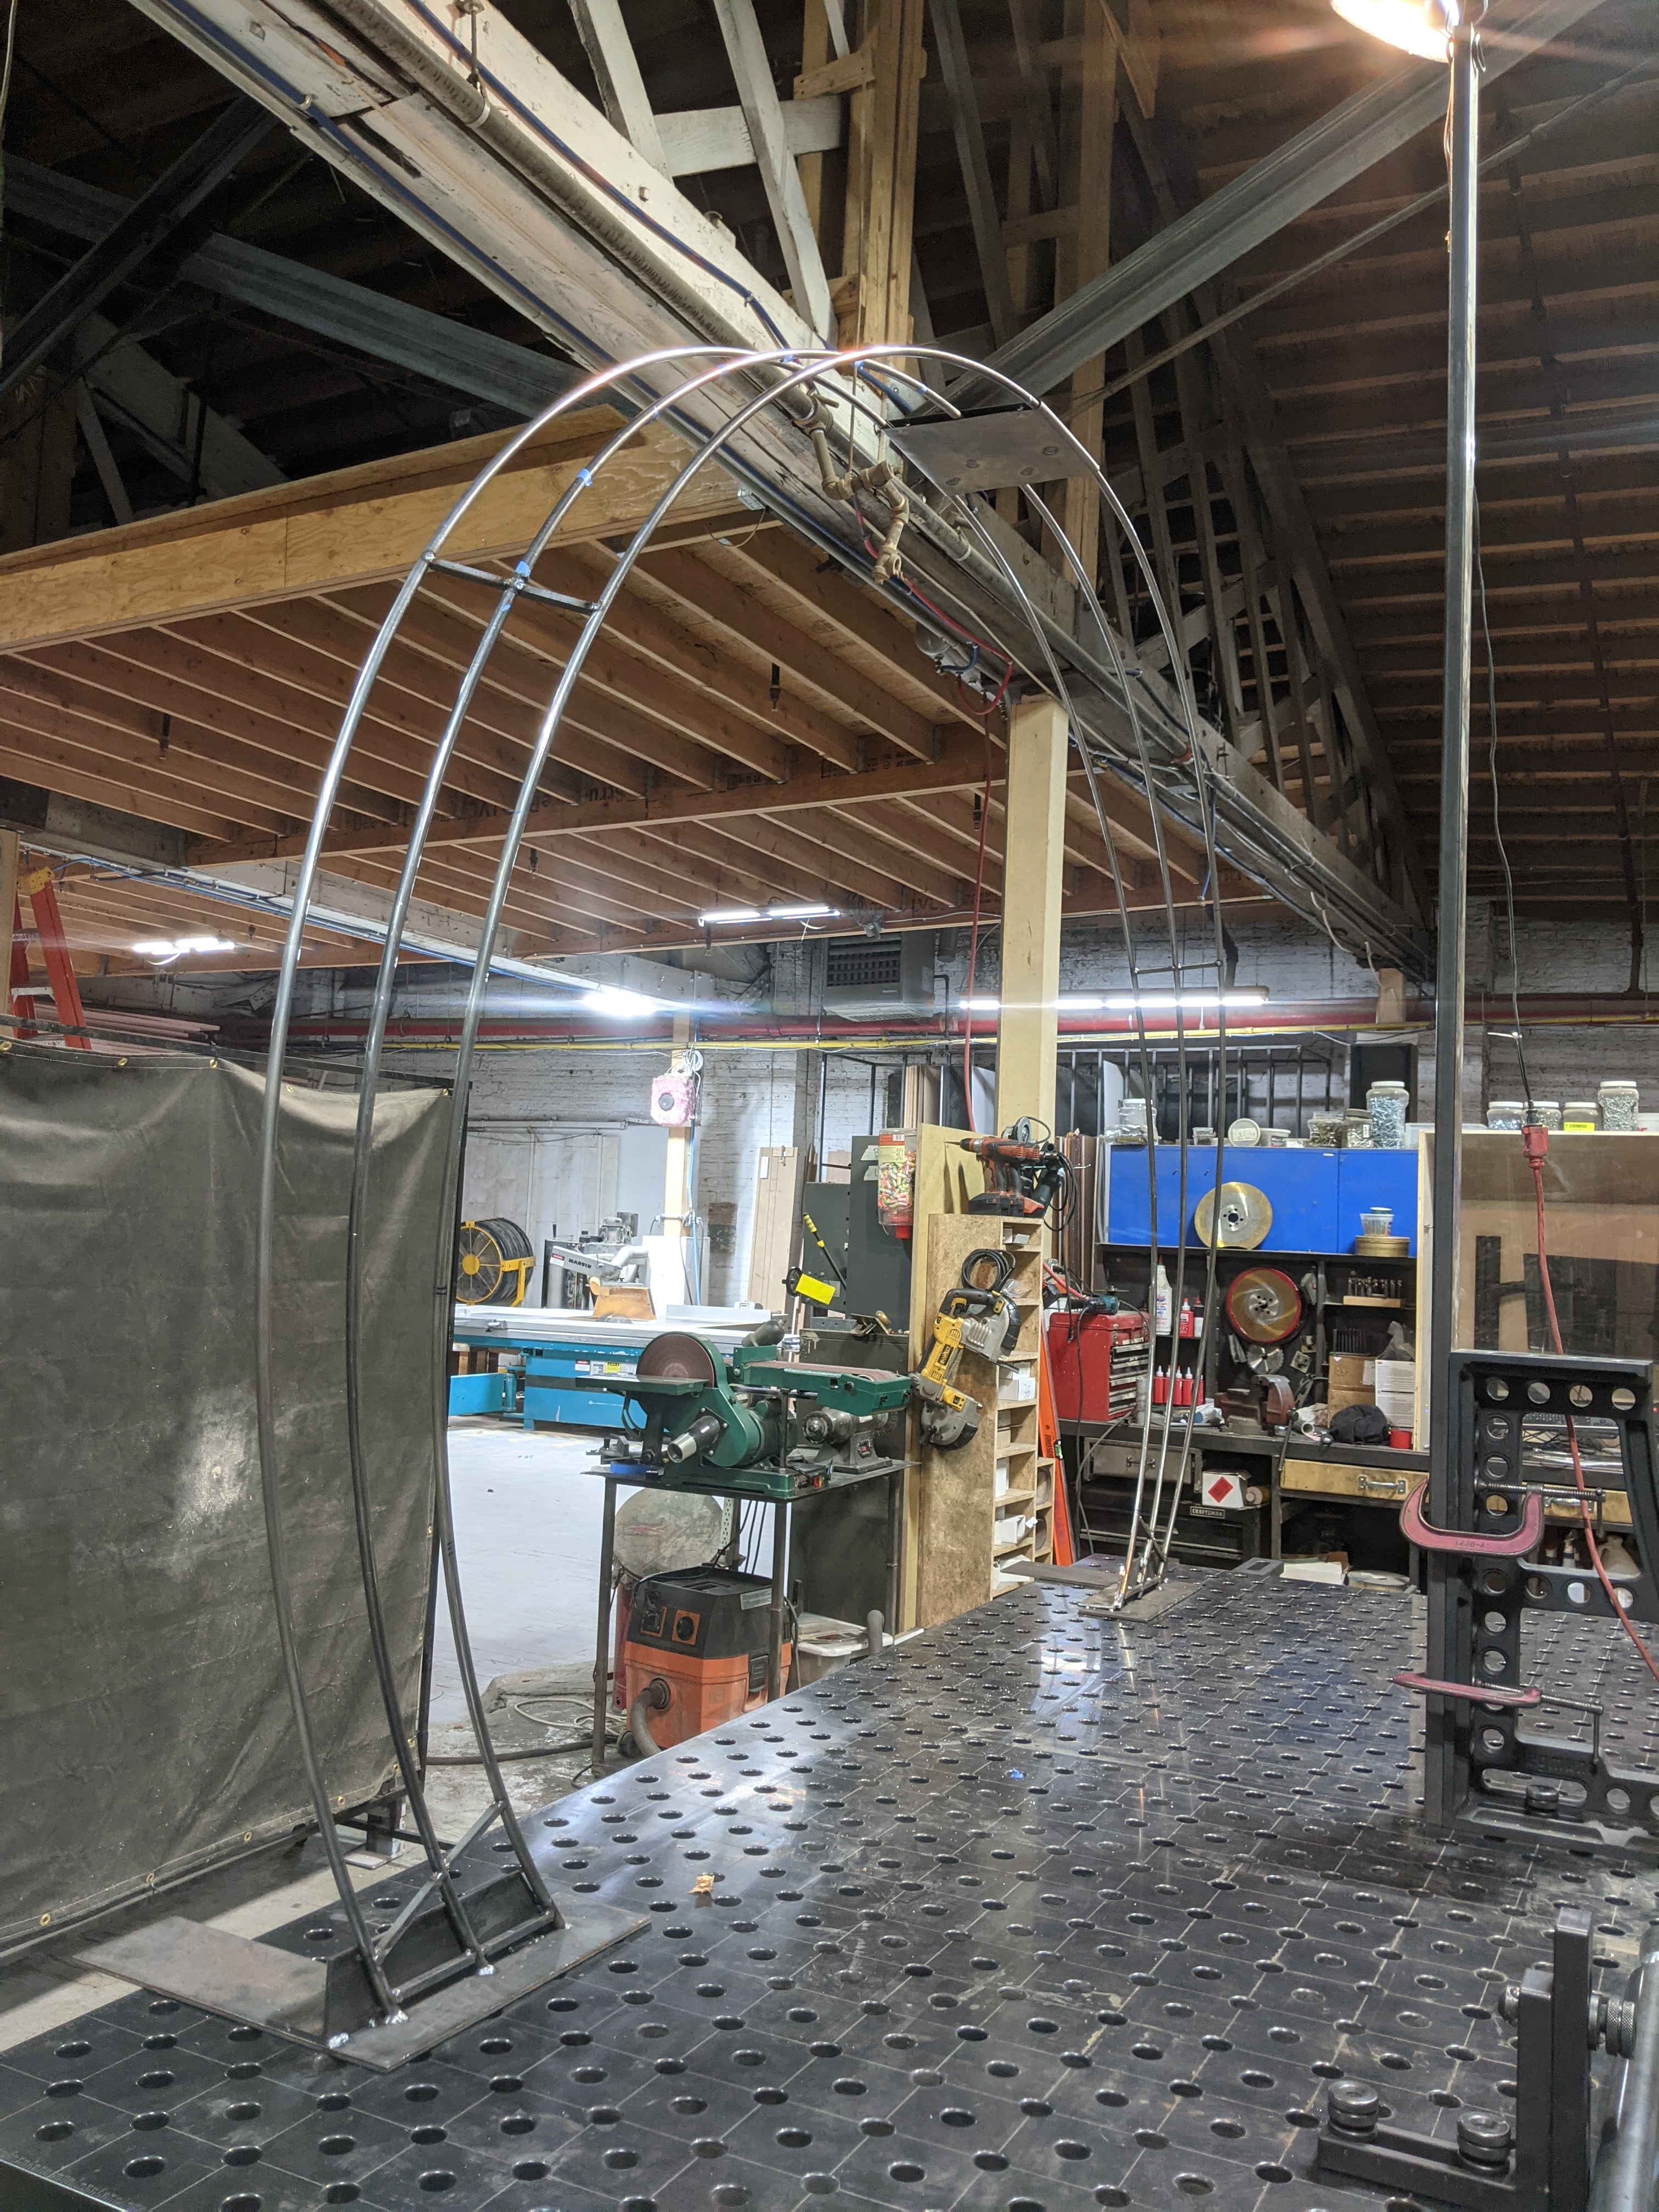
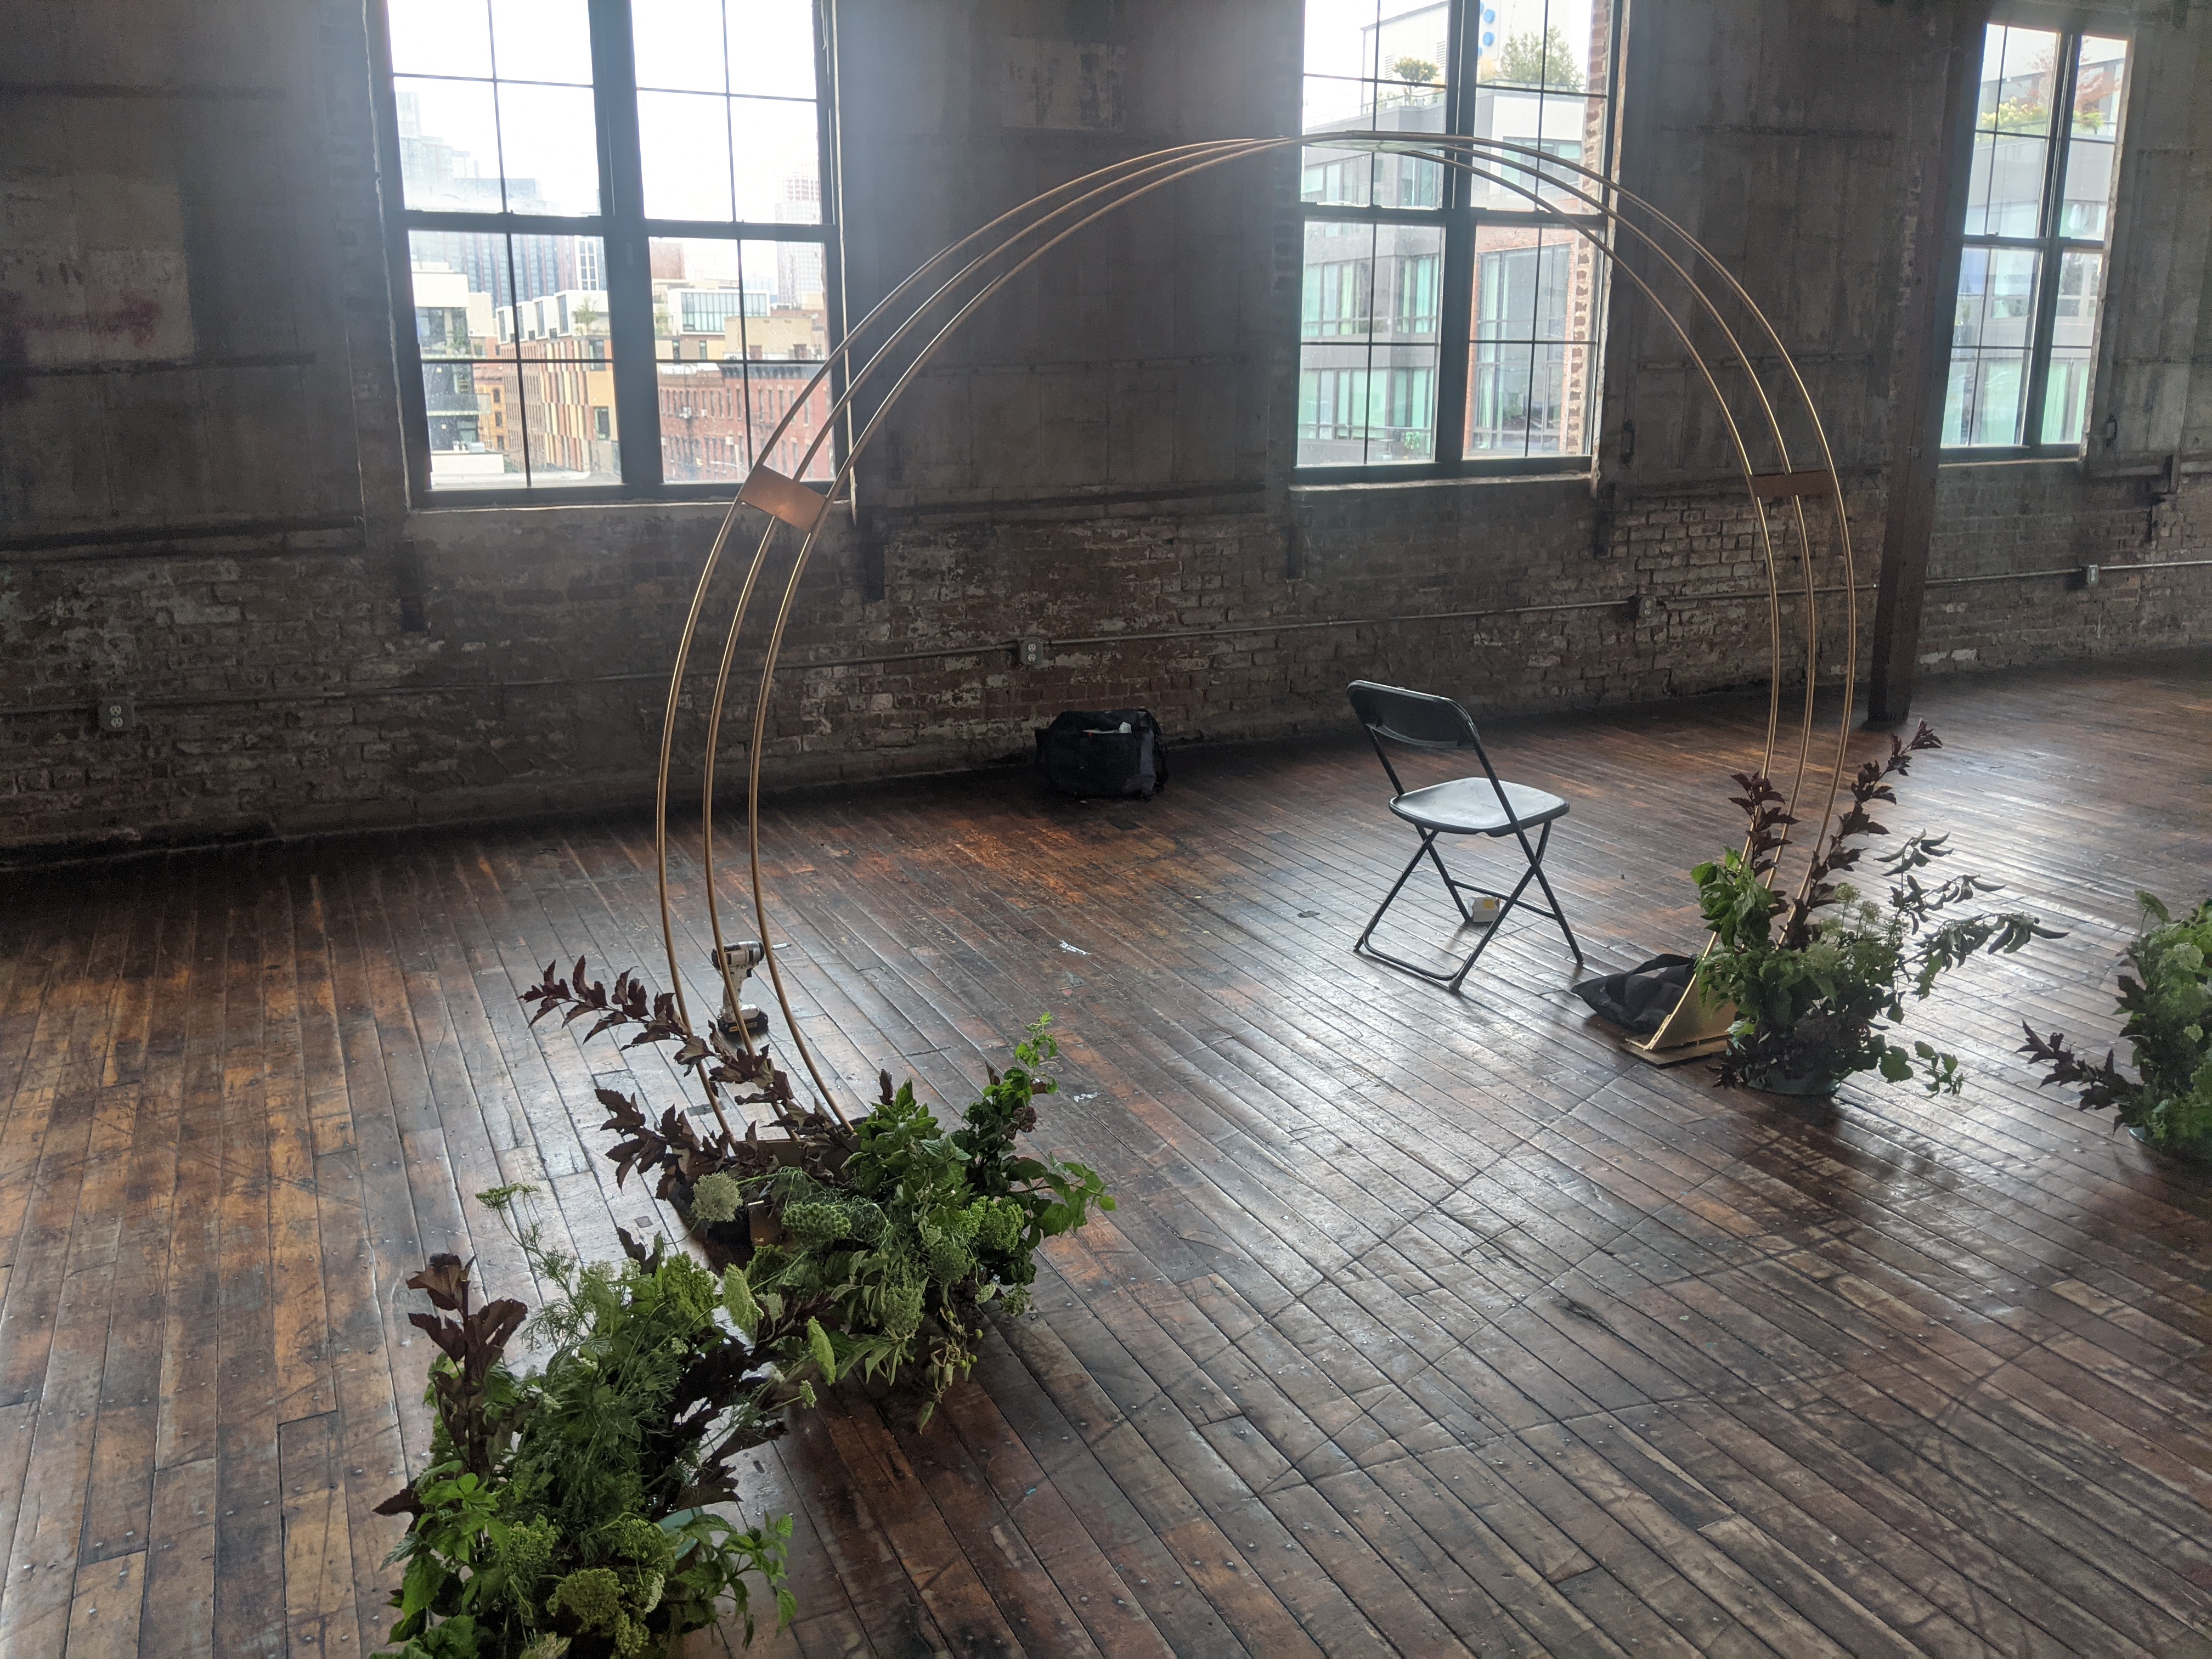
Hello, this is my wedding arch.

This is the arch for my wedding. I wanted it to be simple but beautiful.
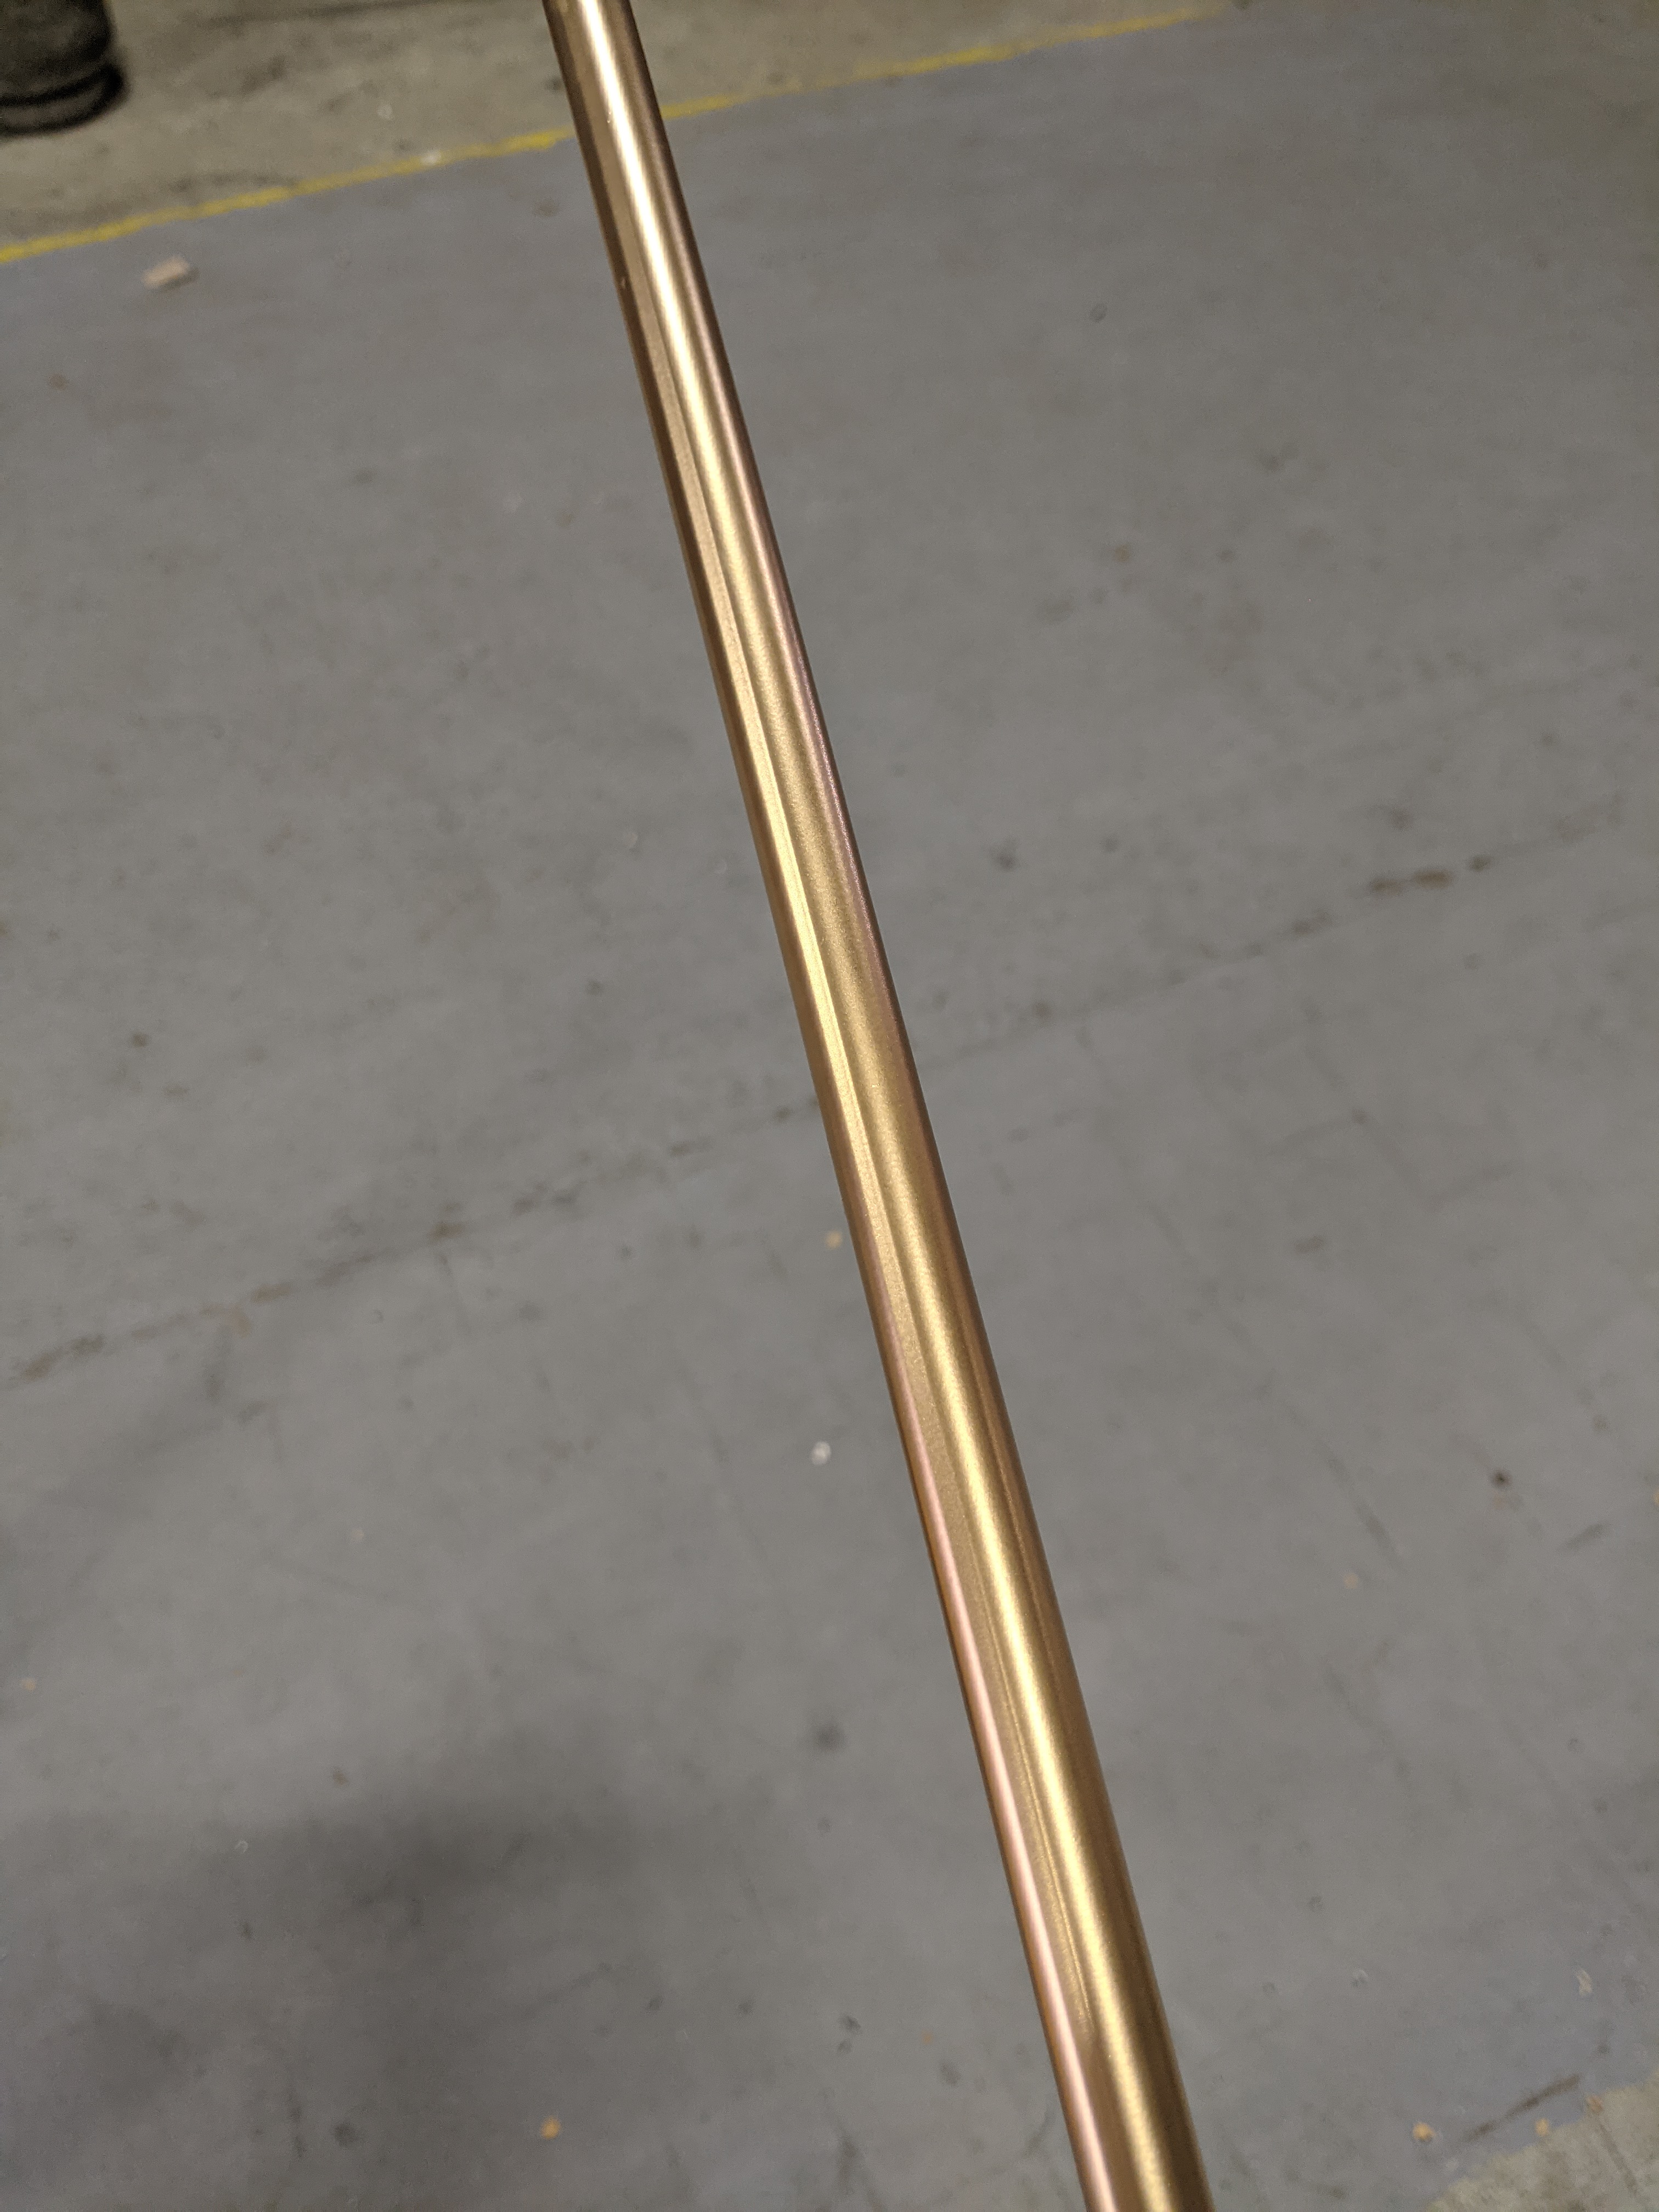
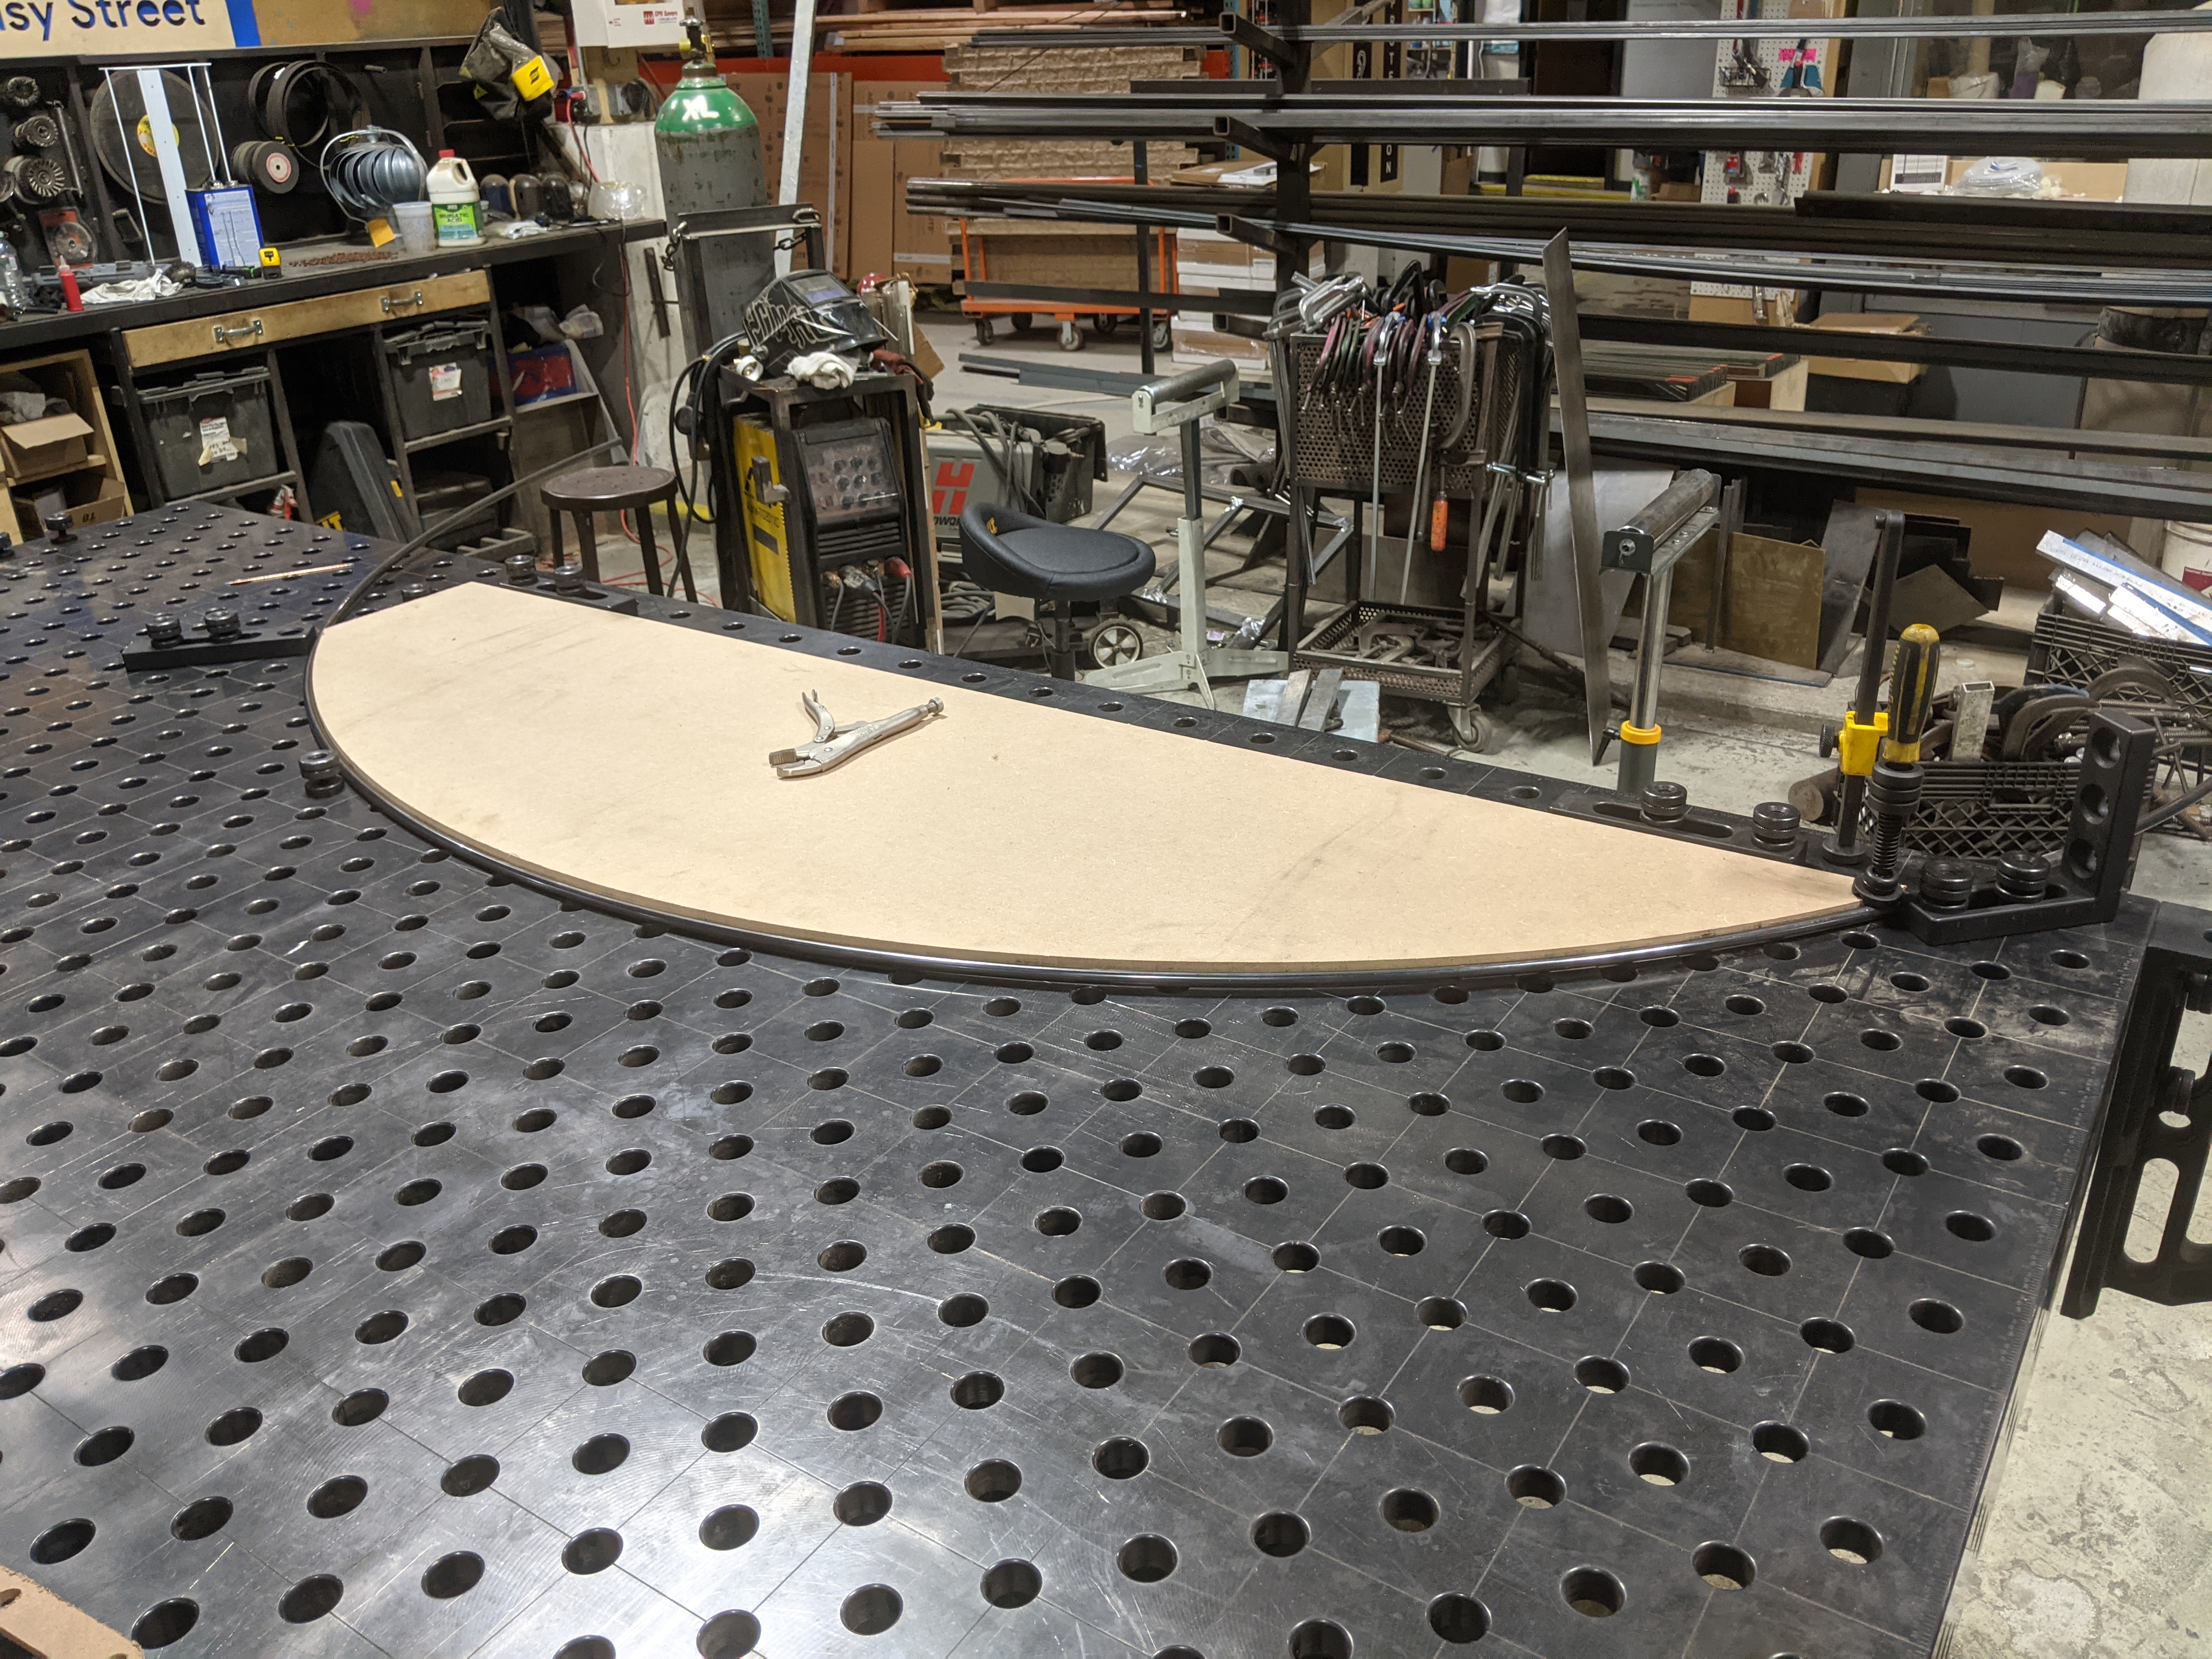
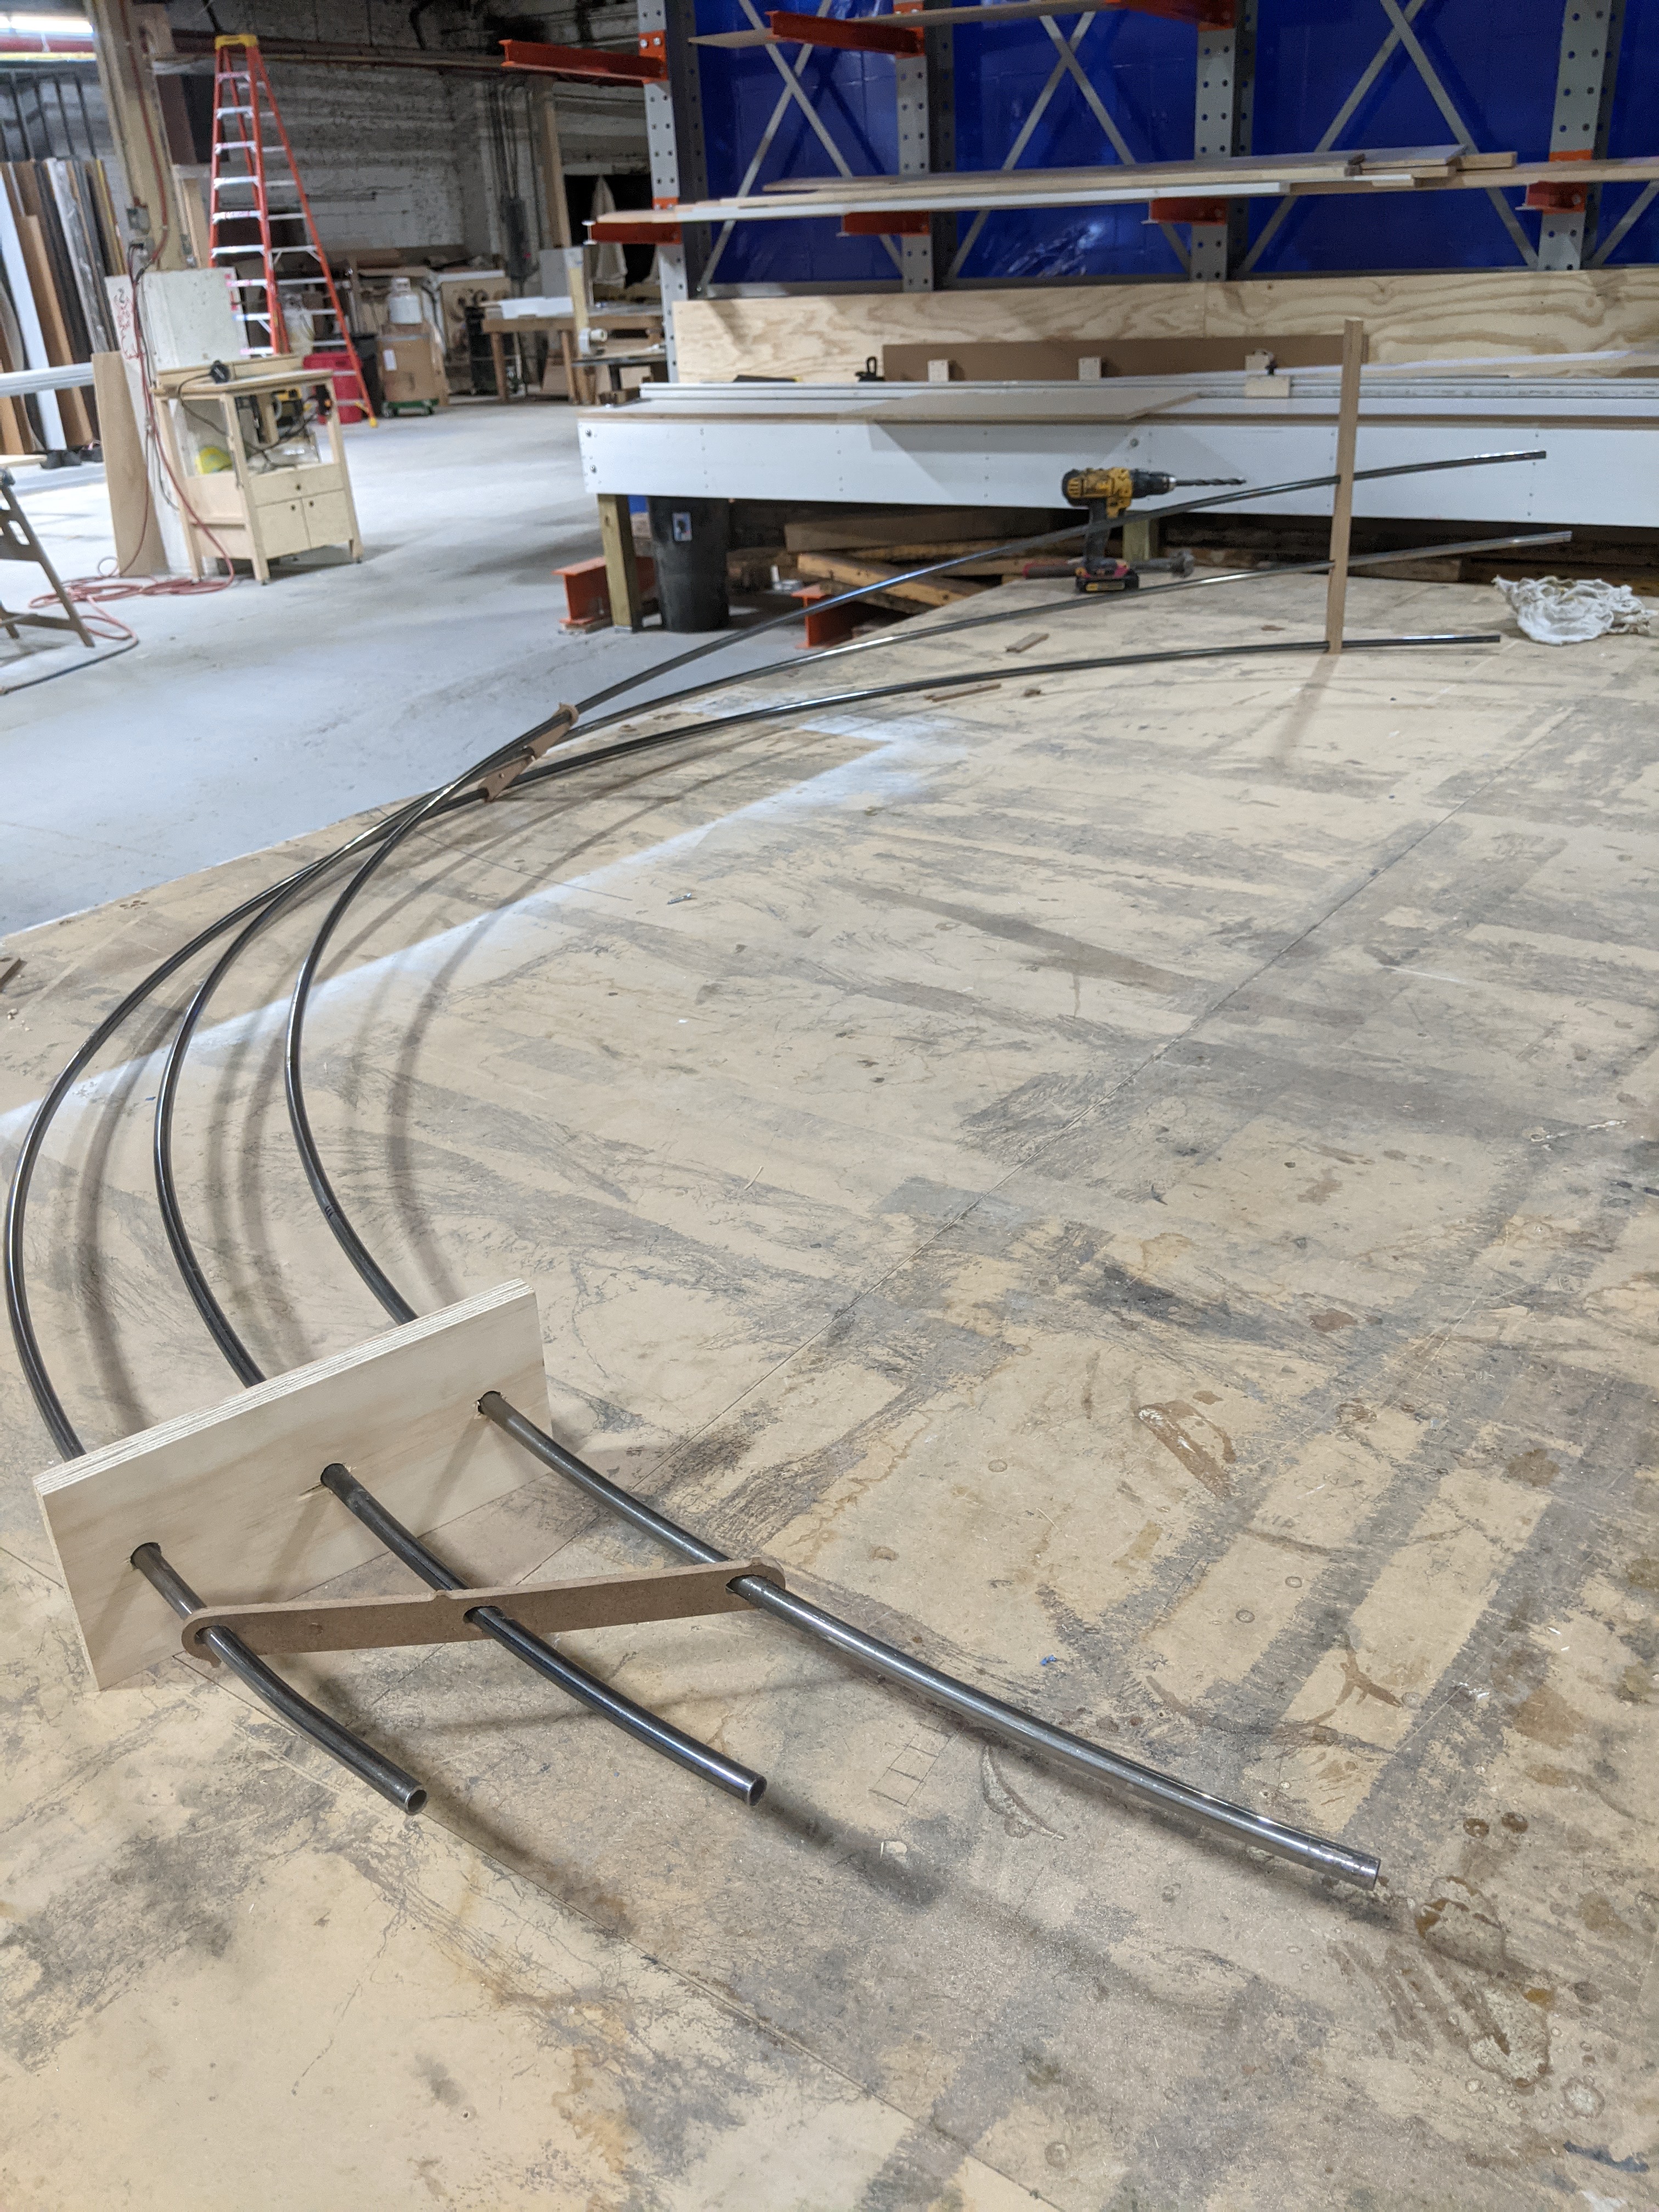
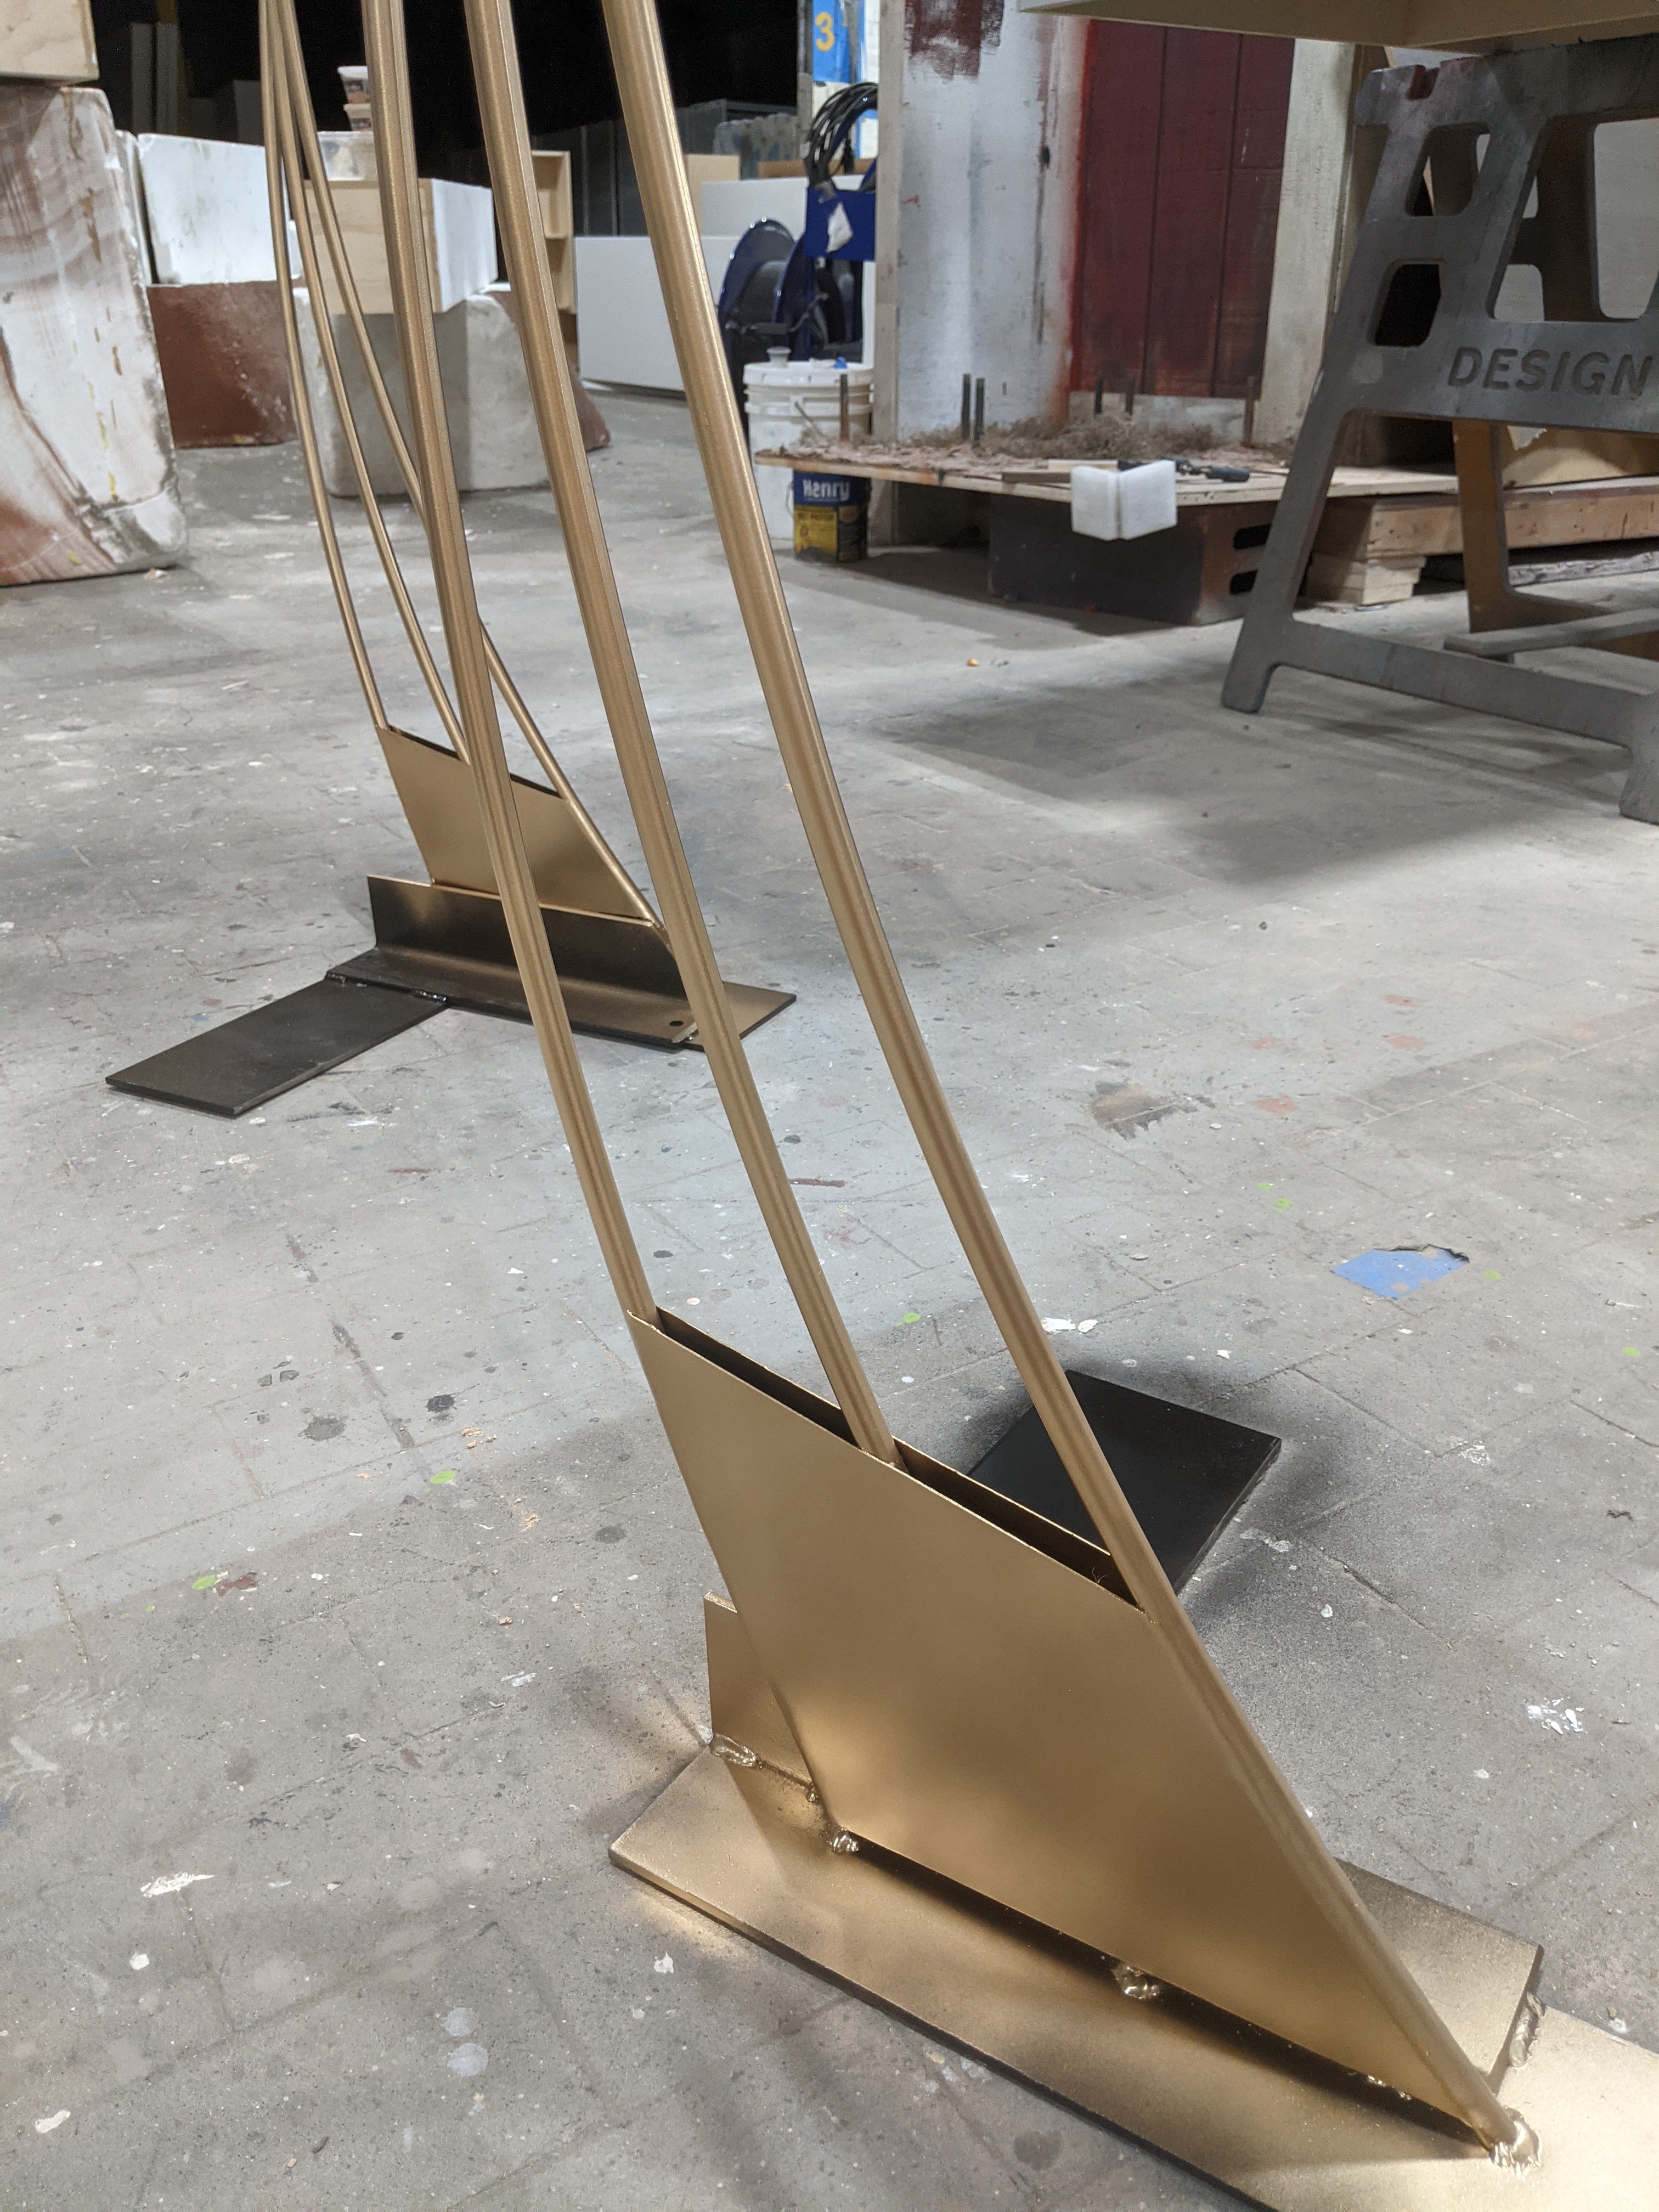
The arch halves slot together and are fastened at the top. Getting the curves just right and setting up a fixturing method for this thing was a fun challenge.



This was a long term project that let me help develop and iterate on a manufacturing process.
Some of the pieces we made were one offs (the reception desk), or built for a specific space (the steel-perf wall), but we made several hundred of the rolling racks.
I was involved in figuring out and executing every step of the process: protoyping, designing permament fixtures, welding, finishing, CNC, delivery and installations.
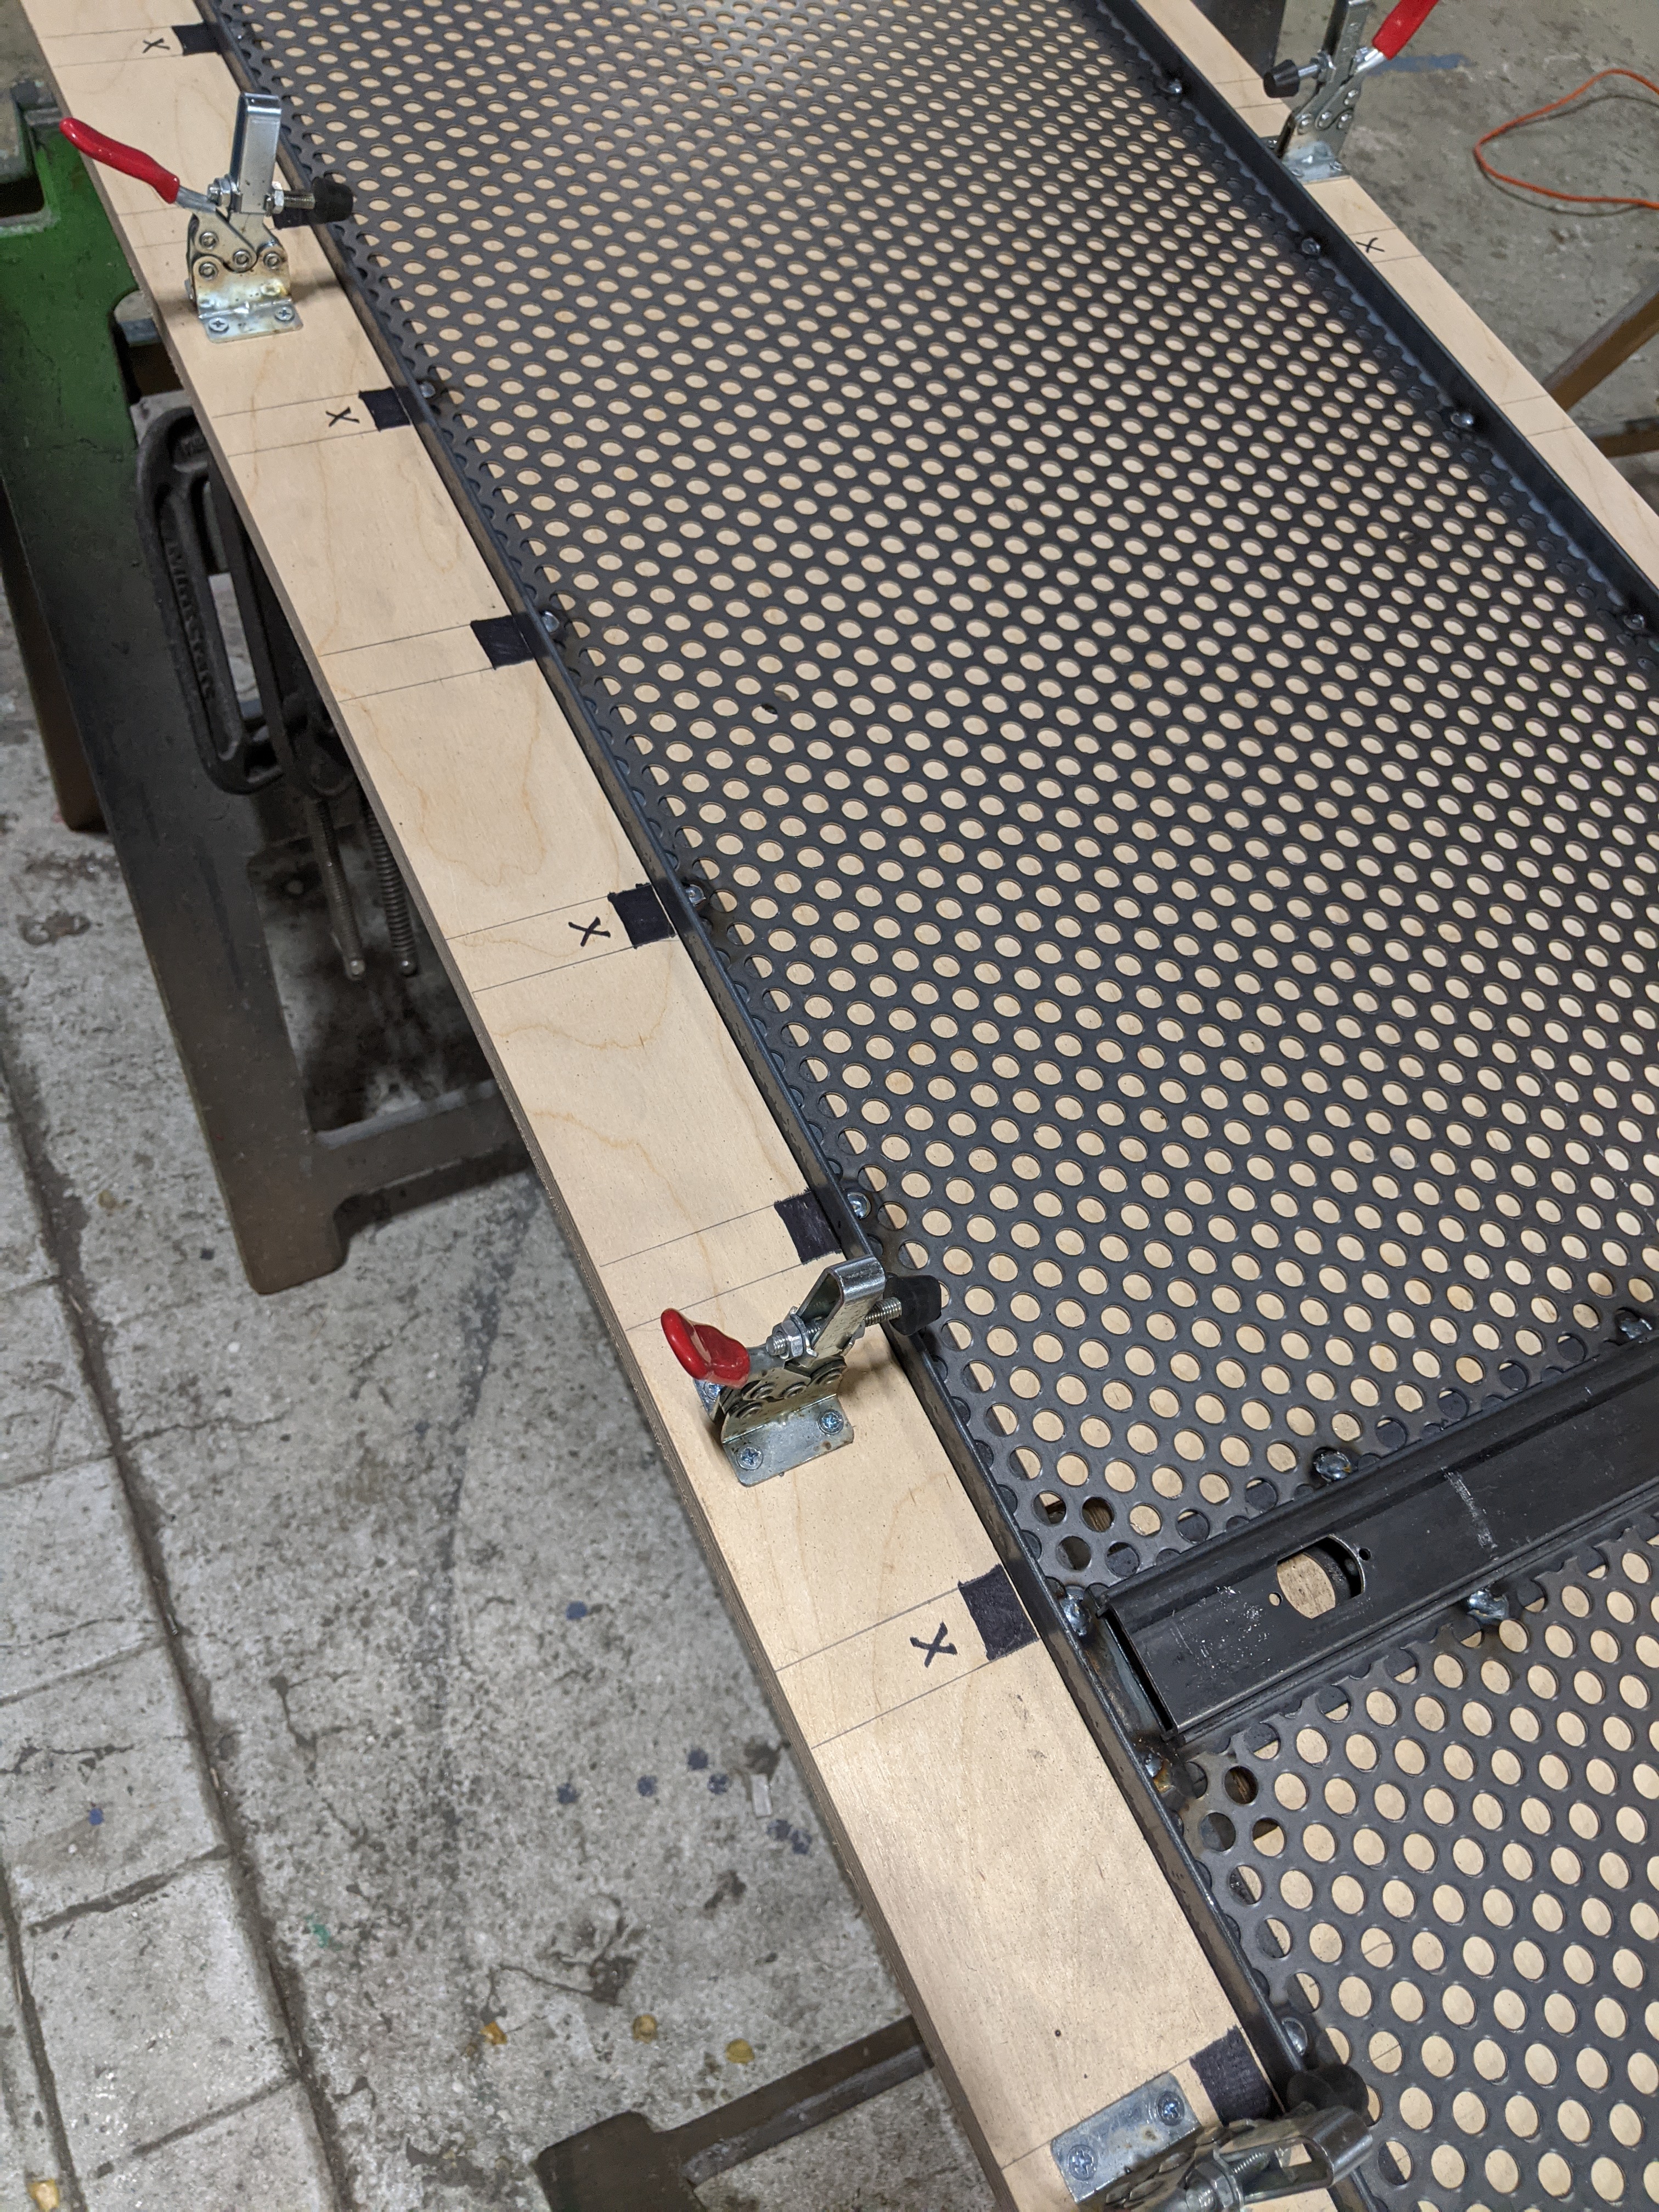
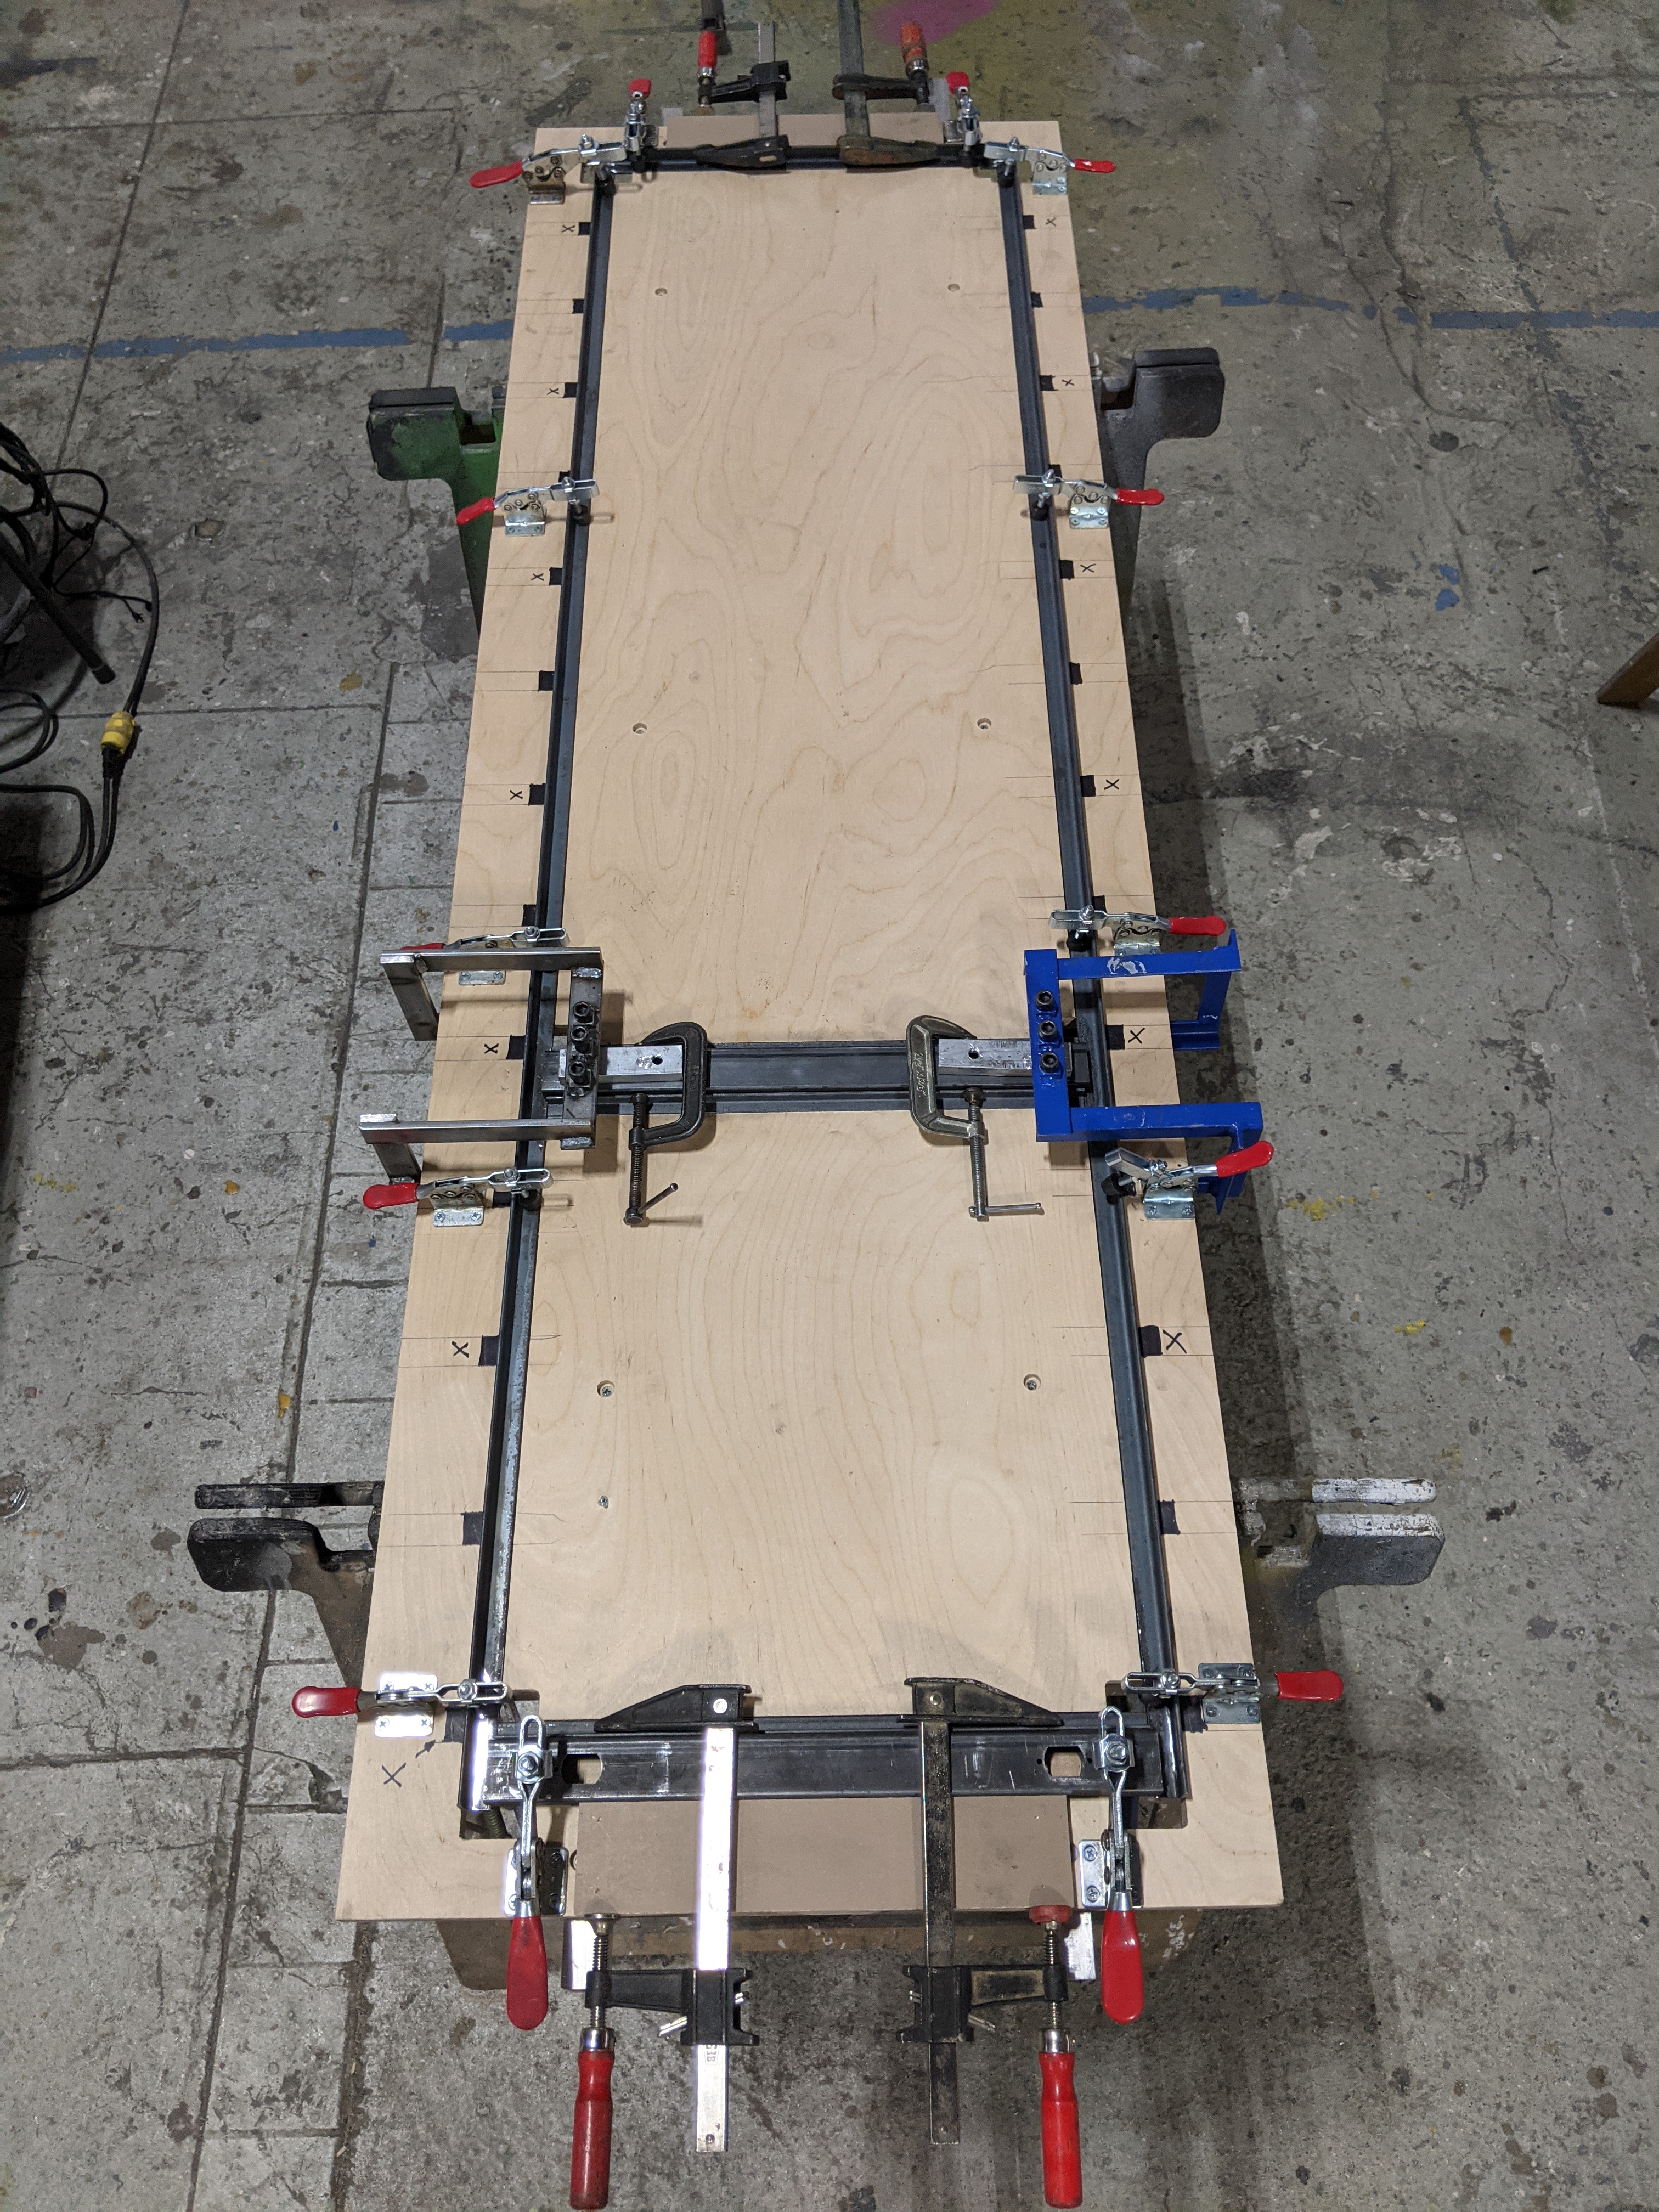
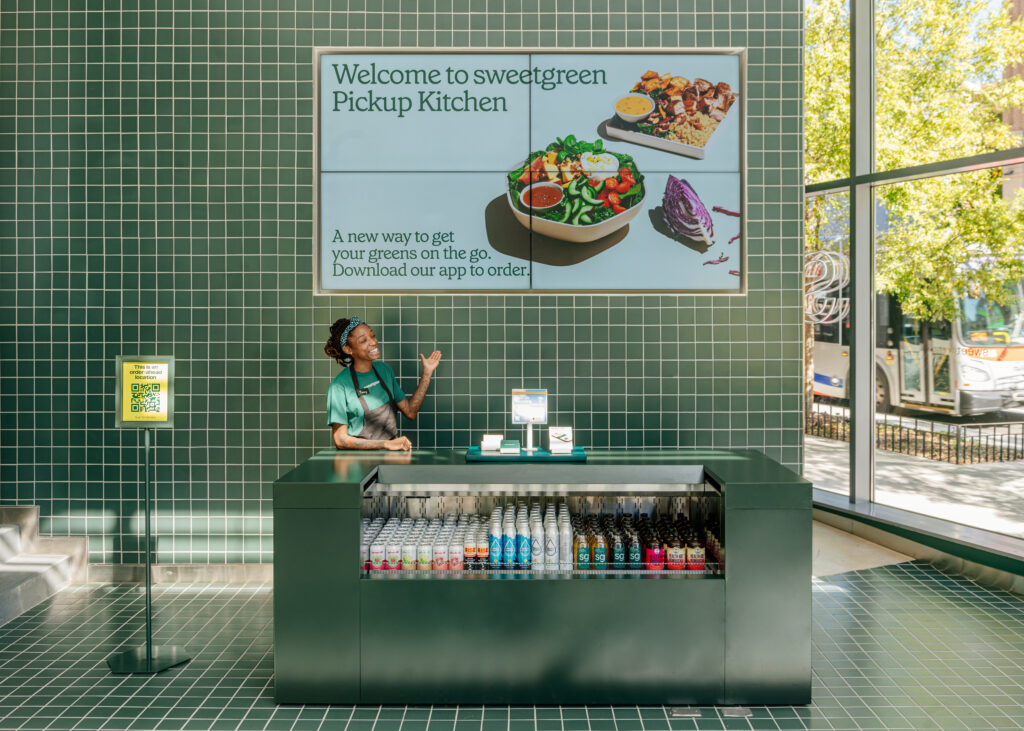
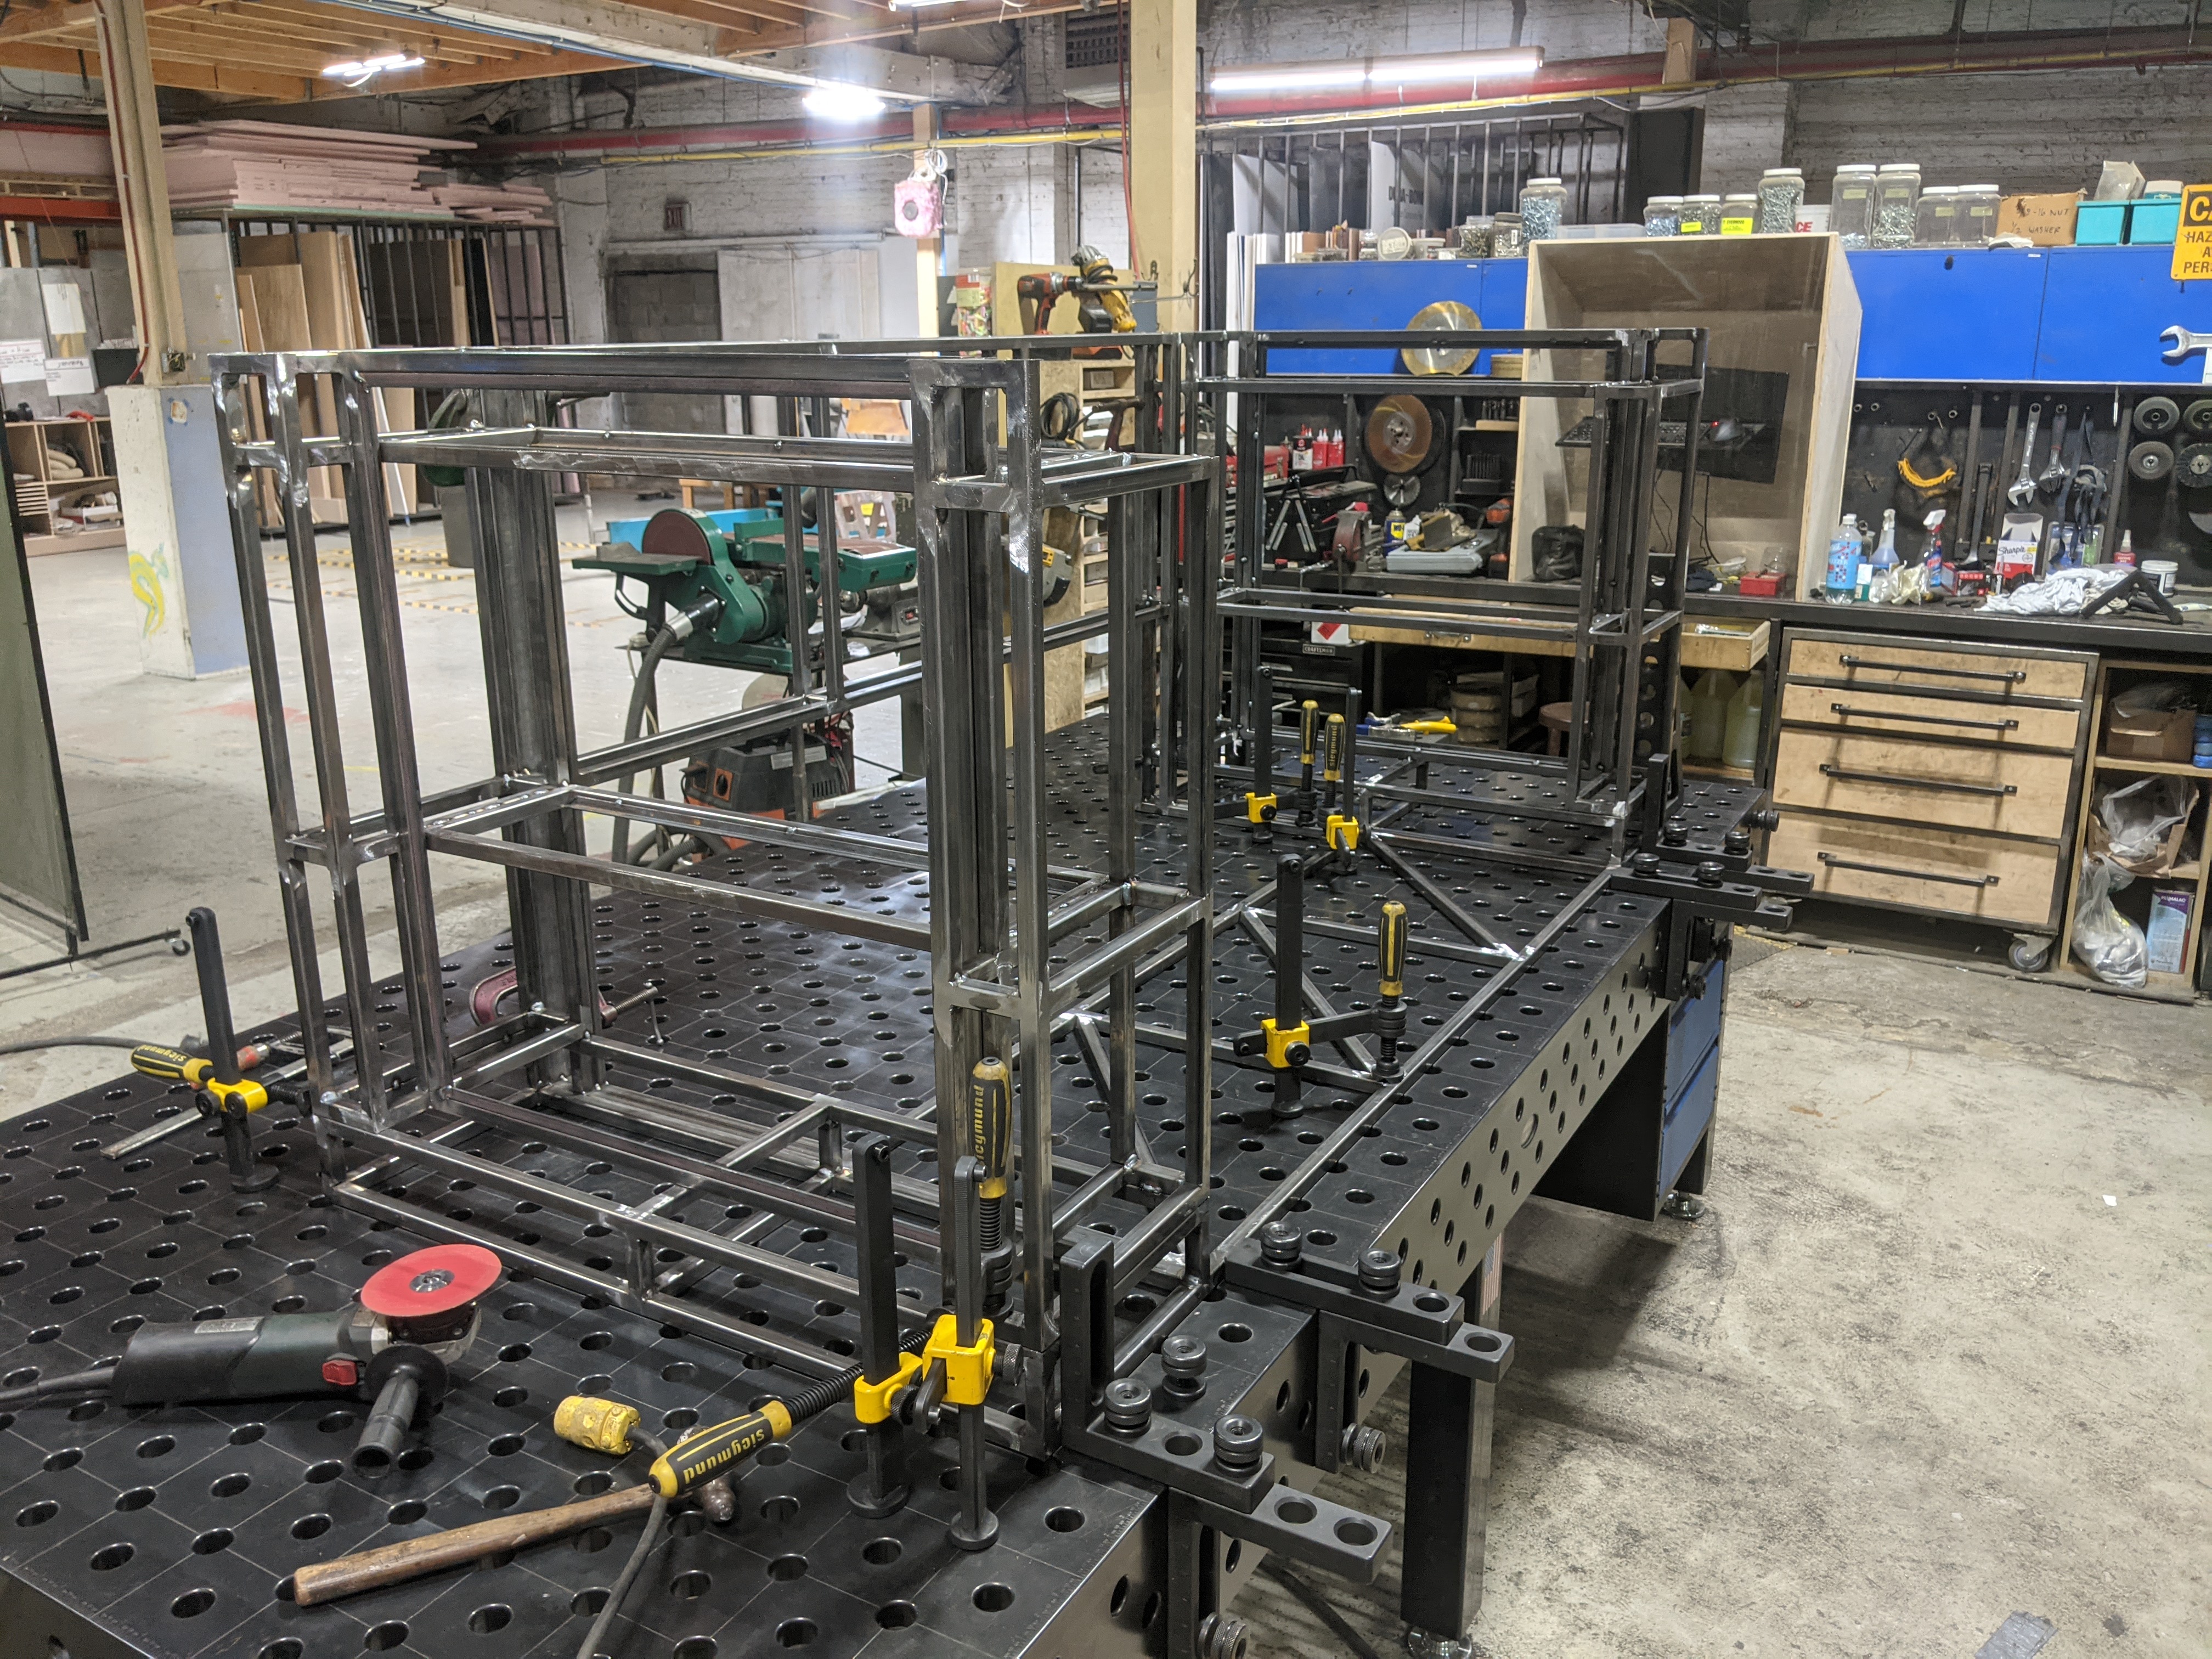
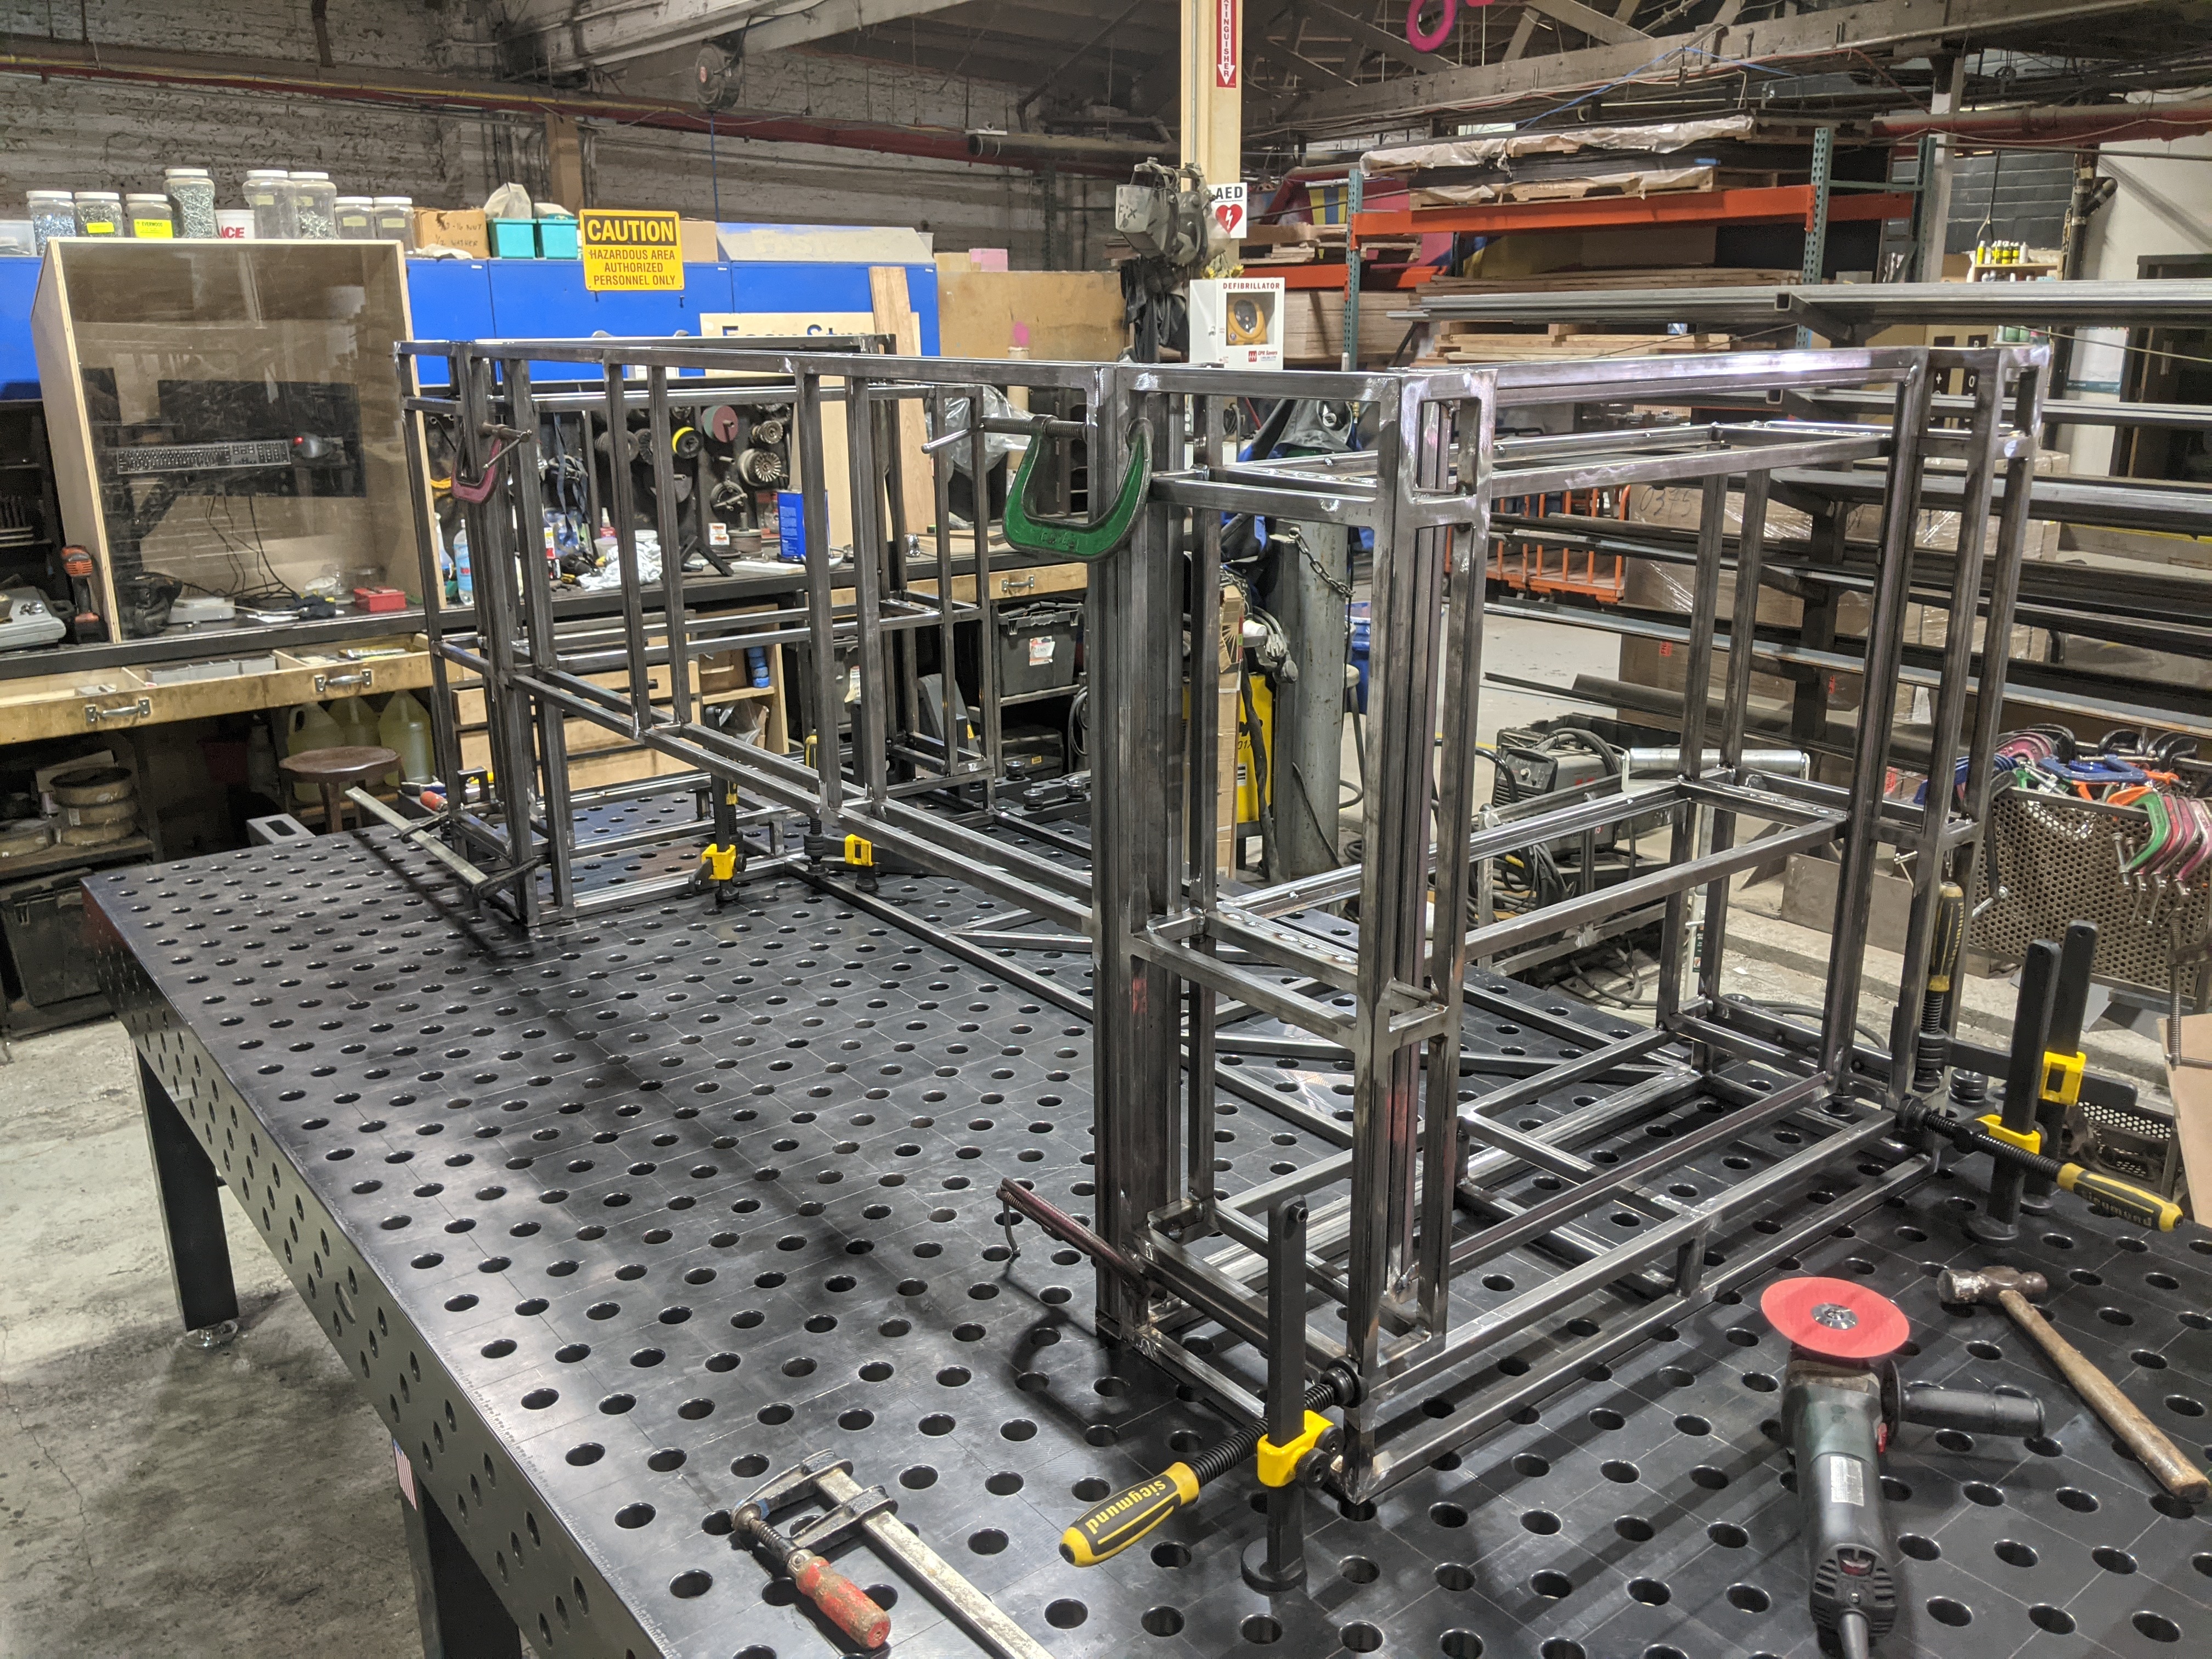
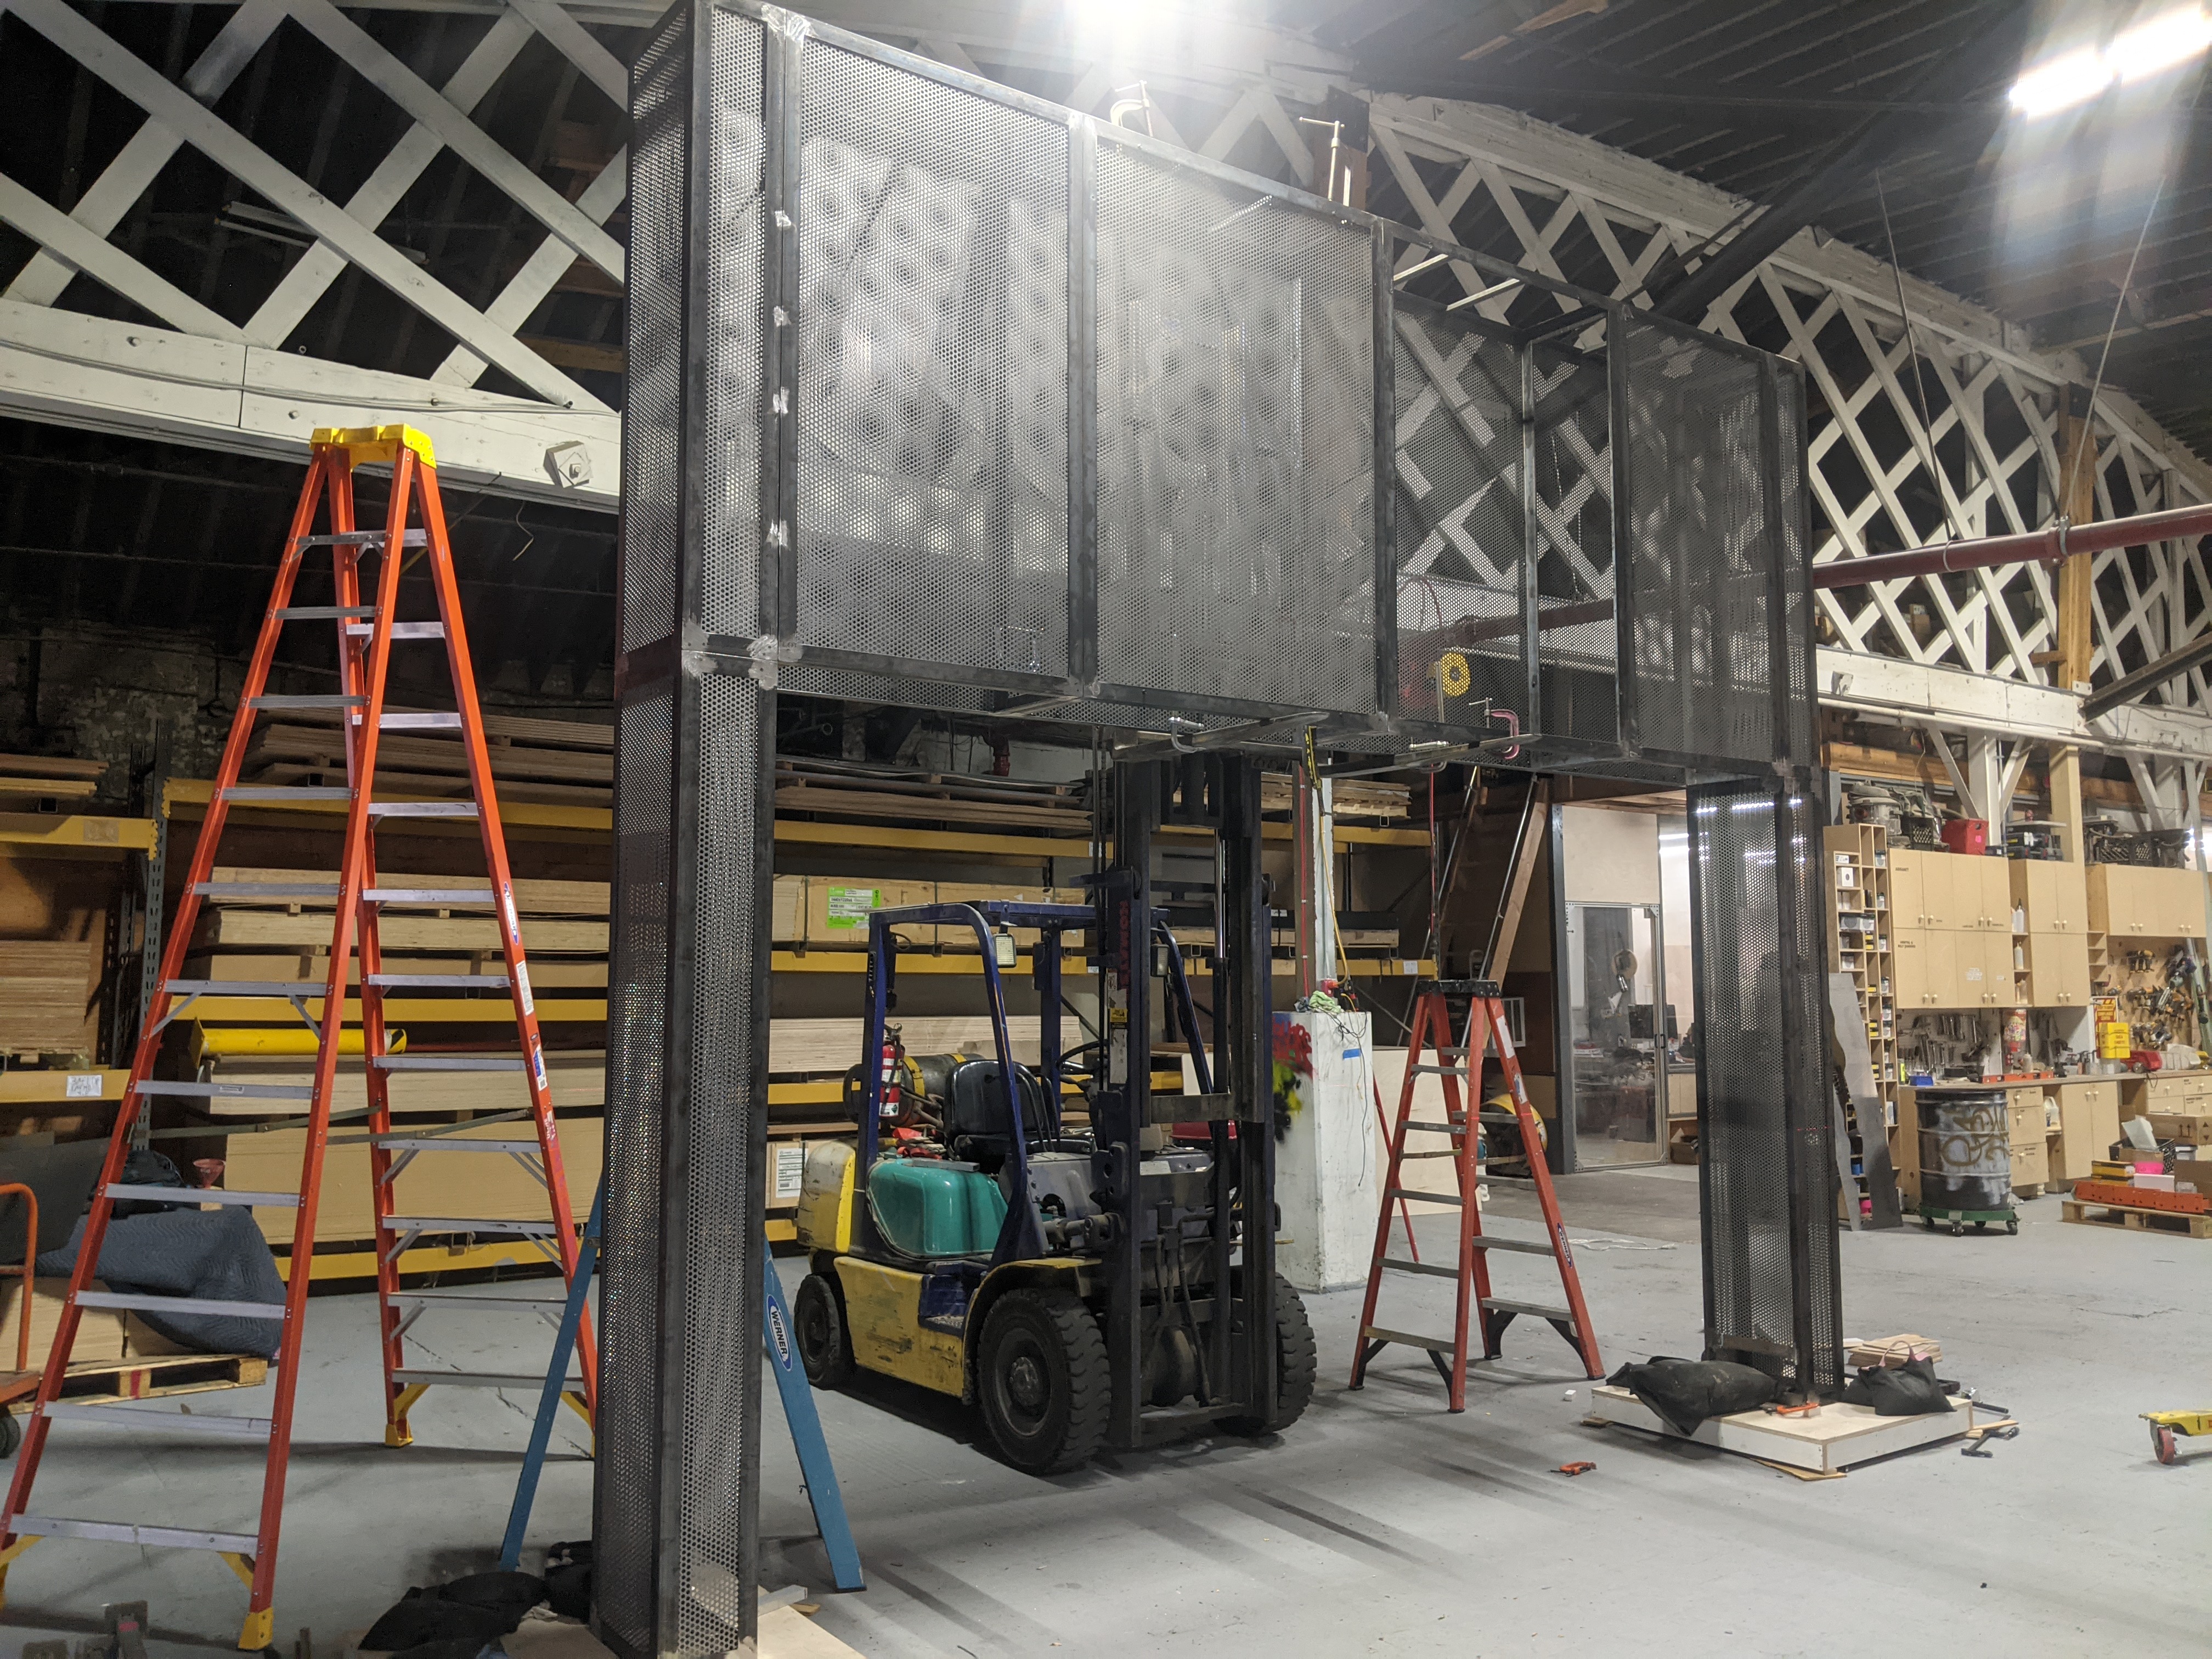
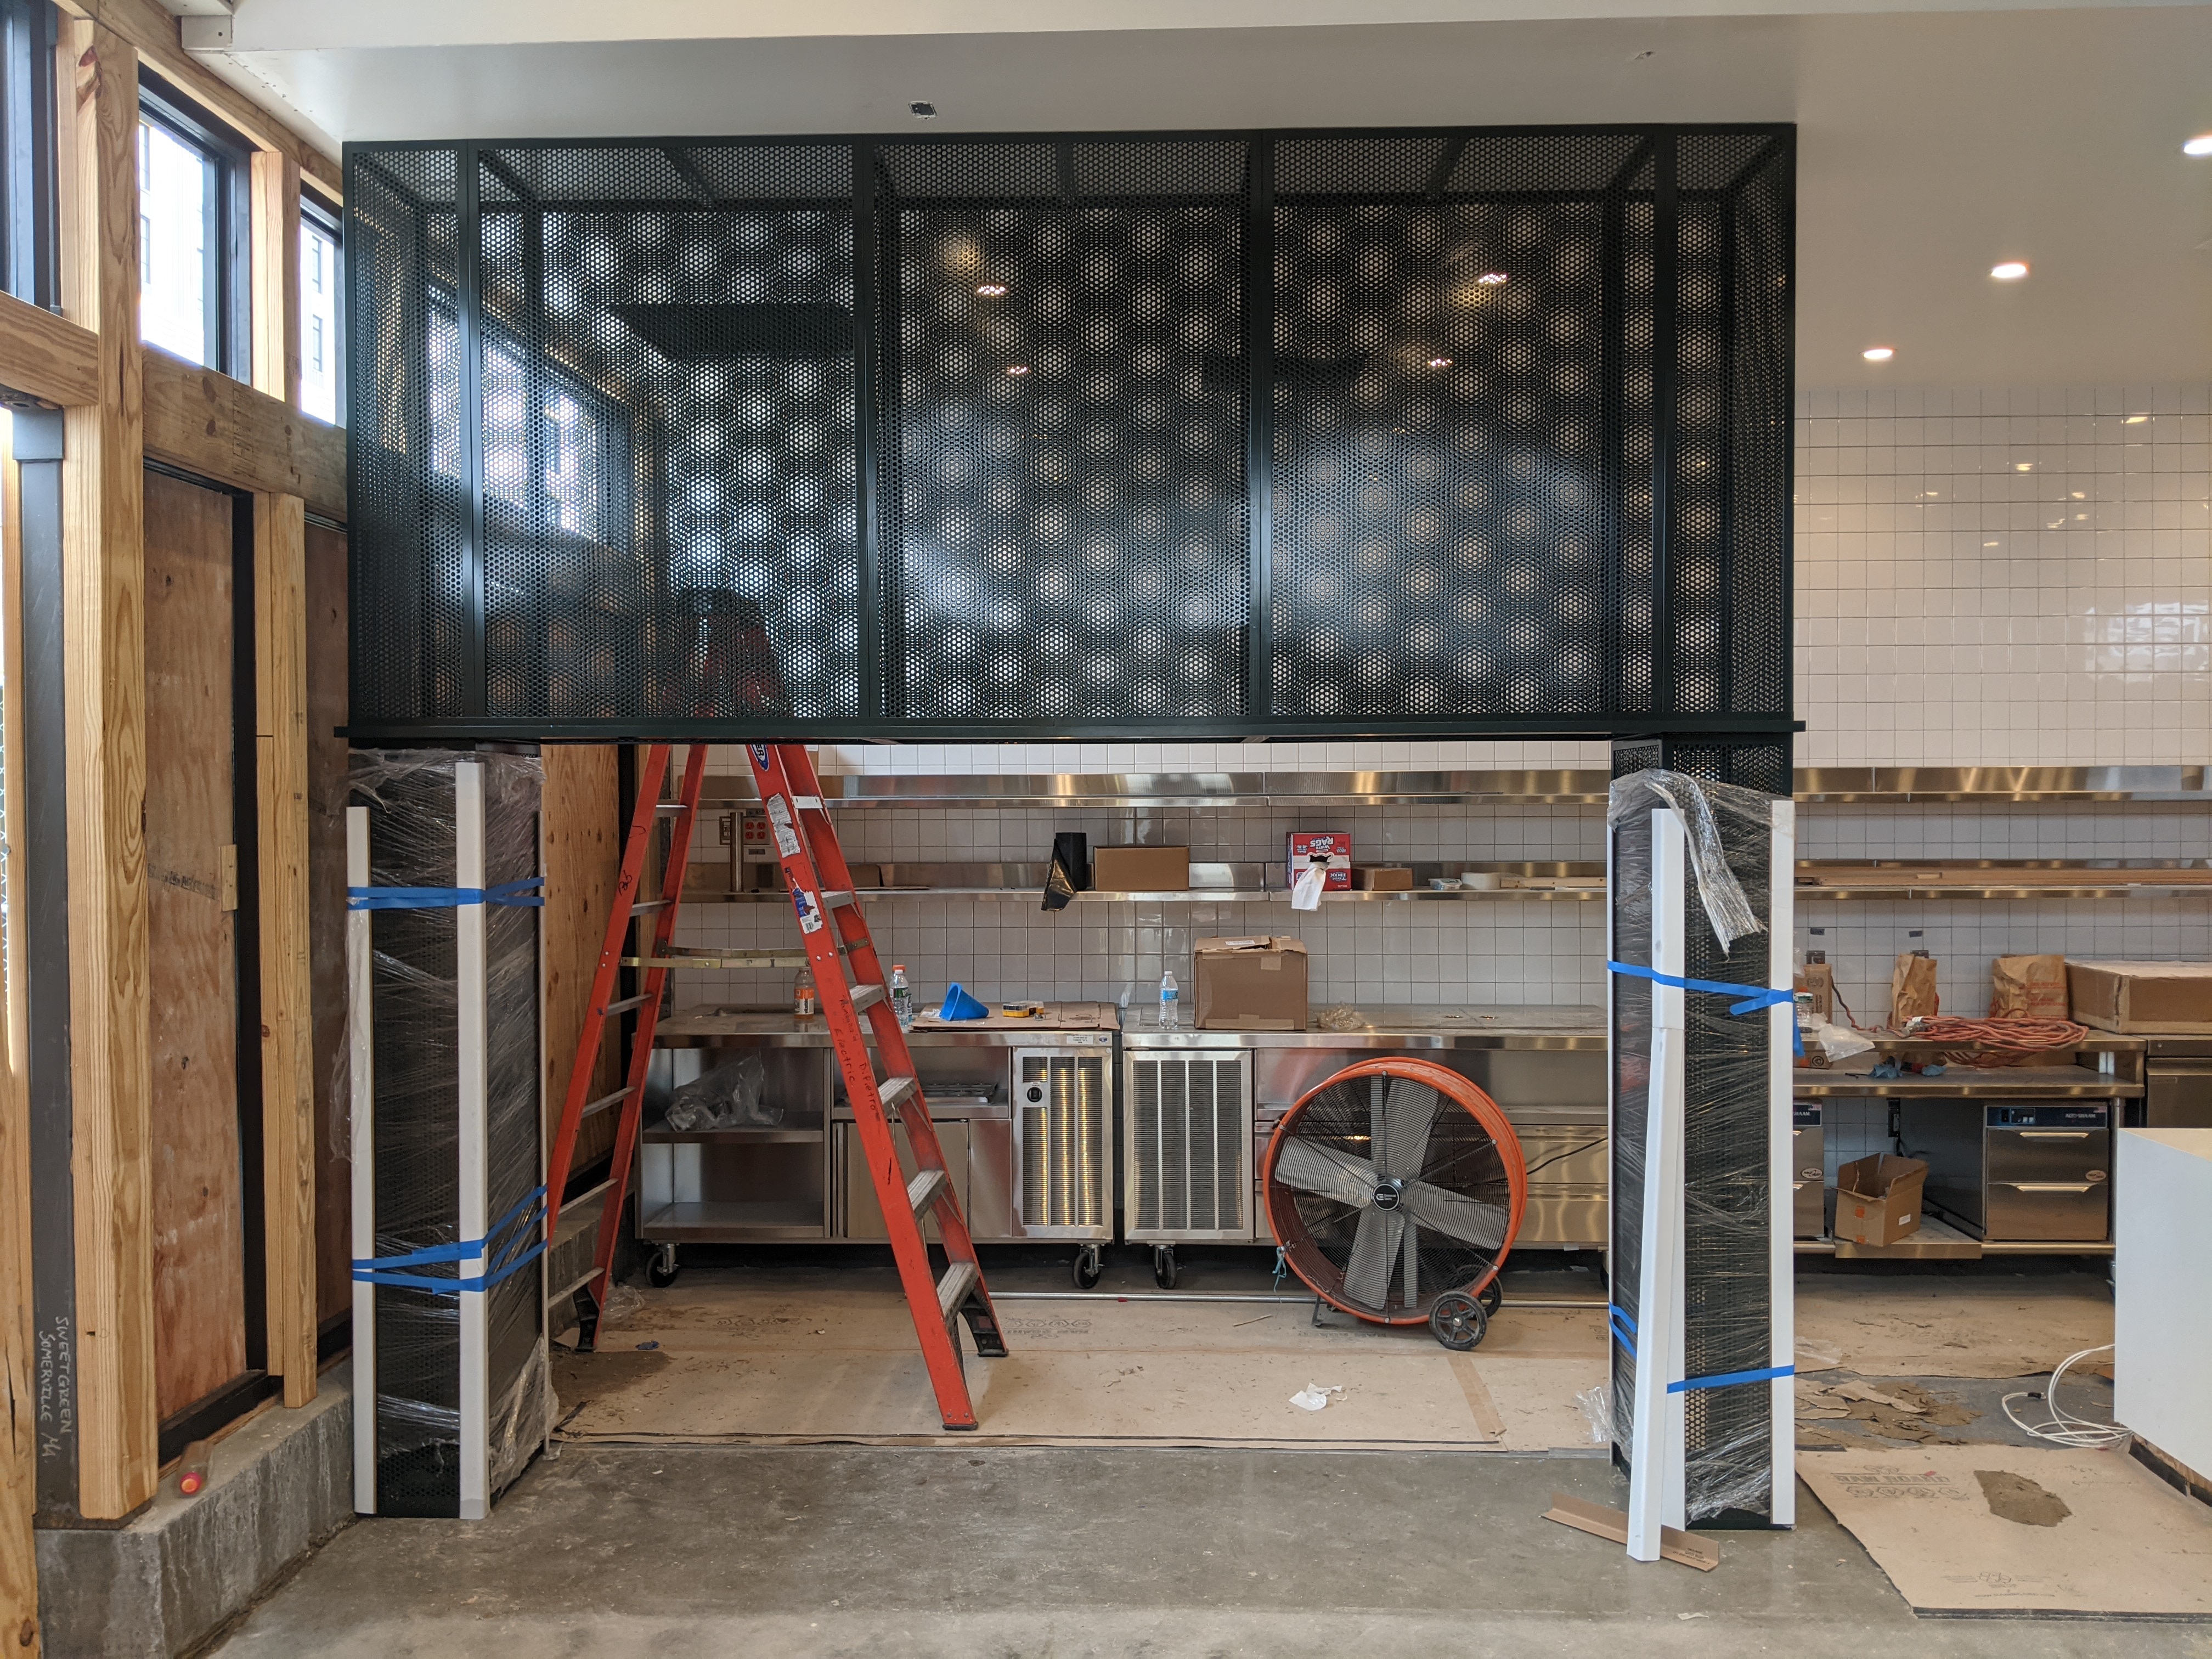
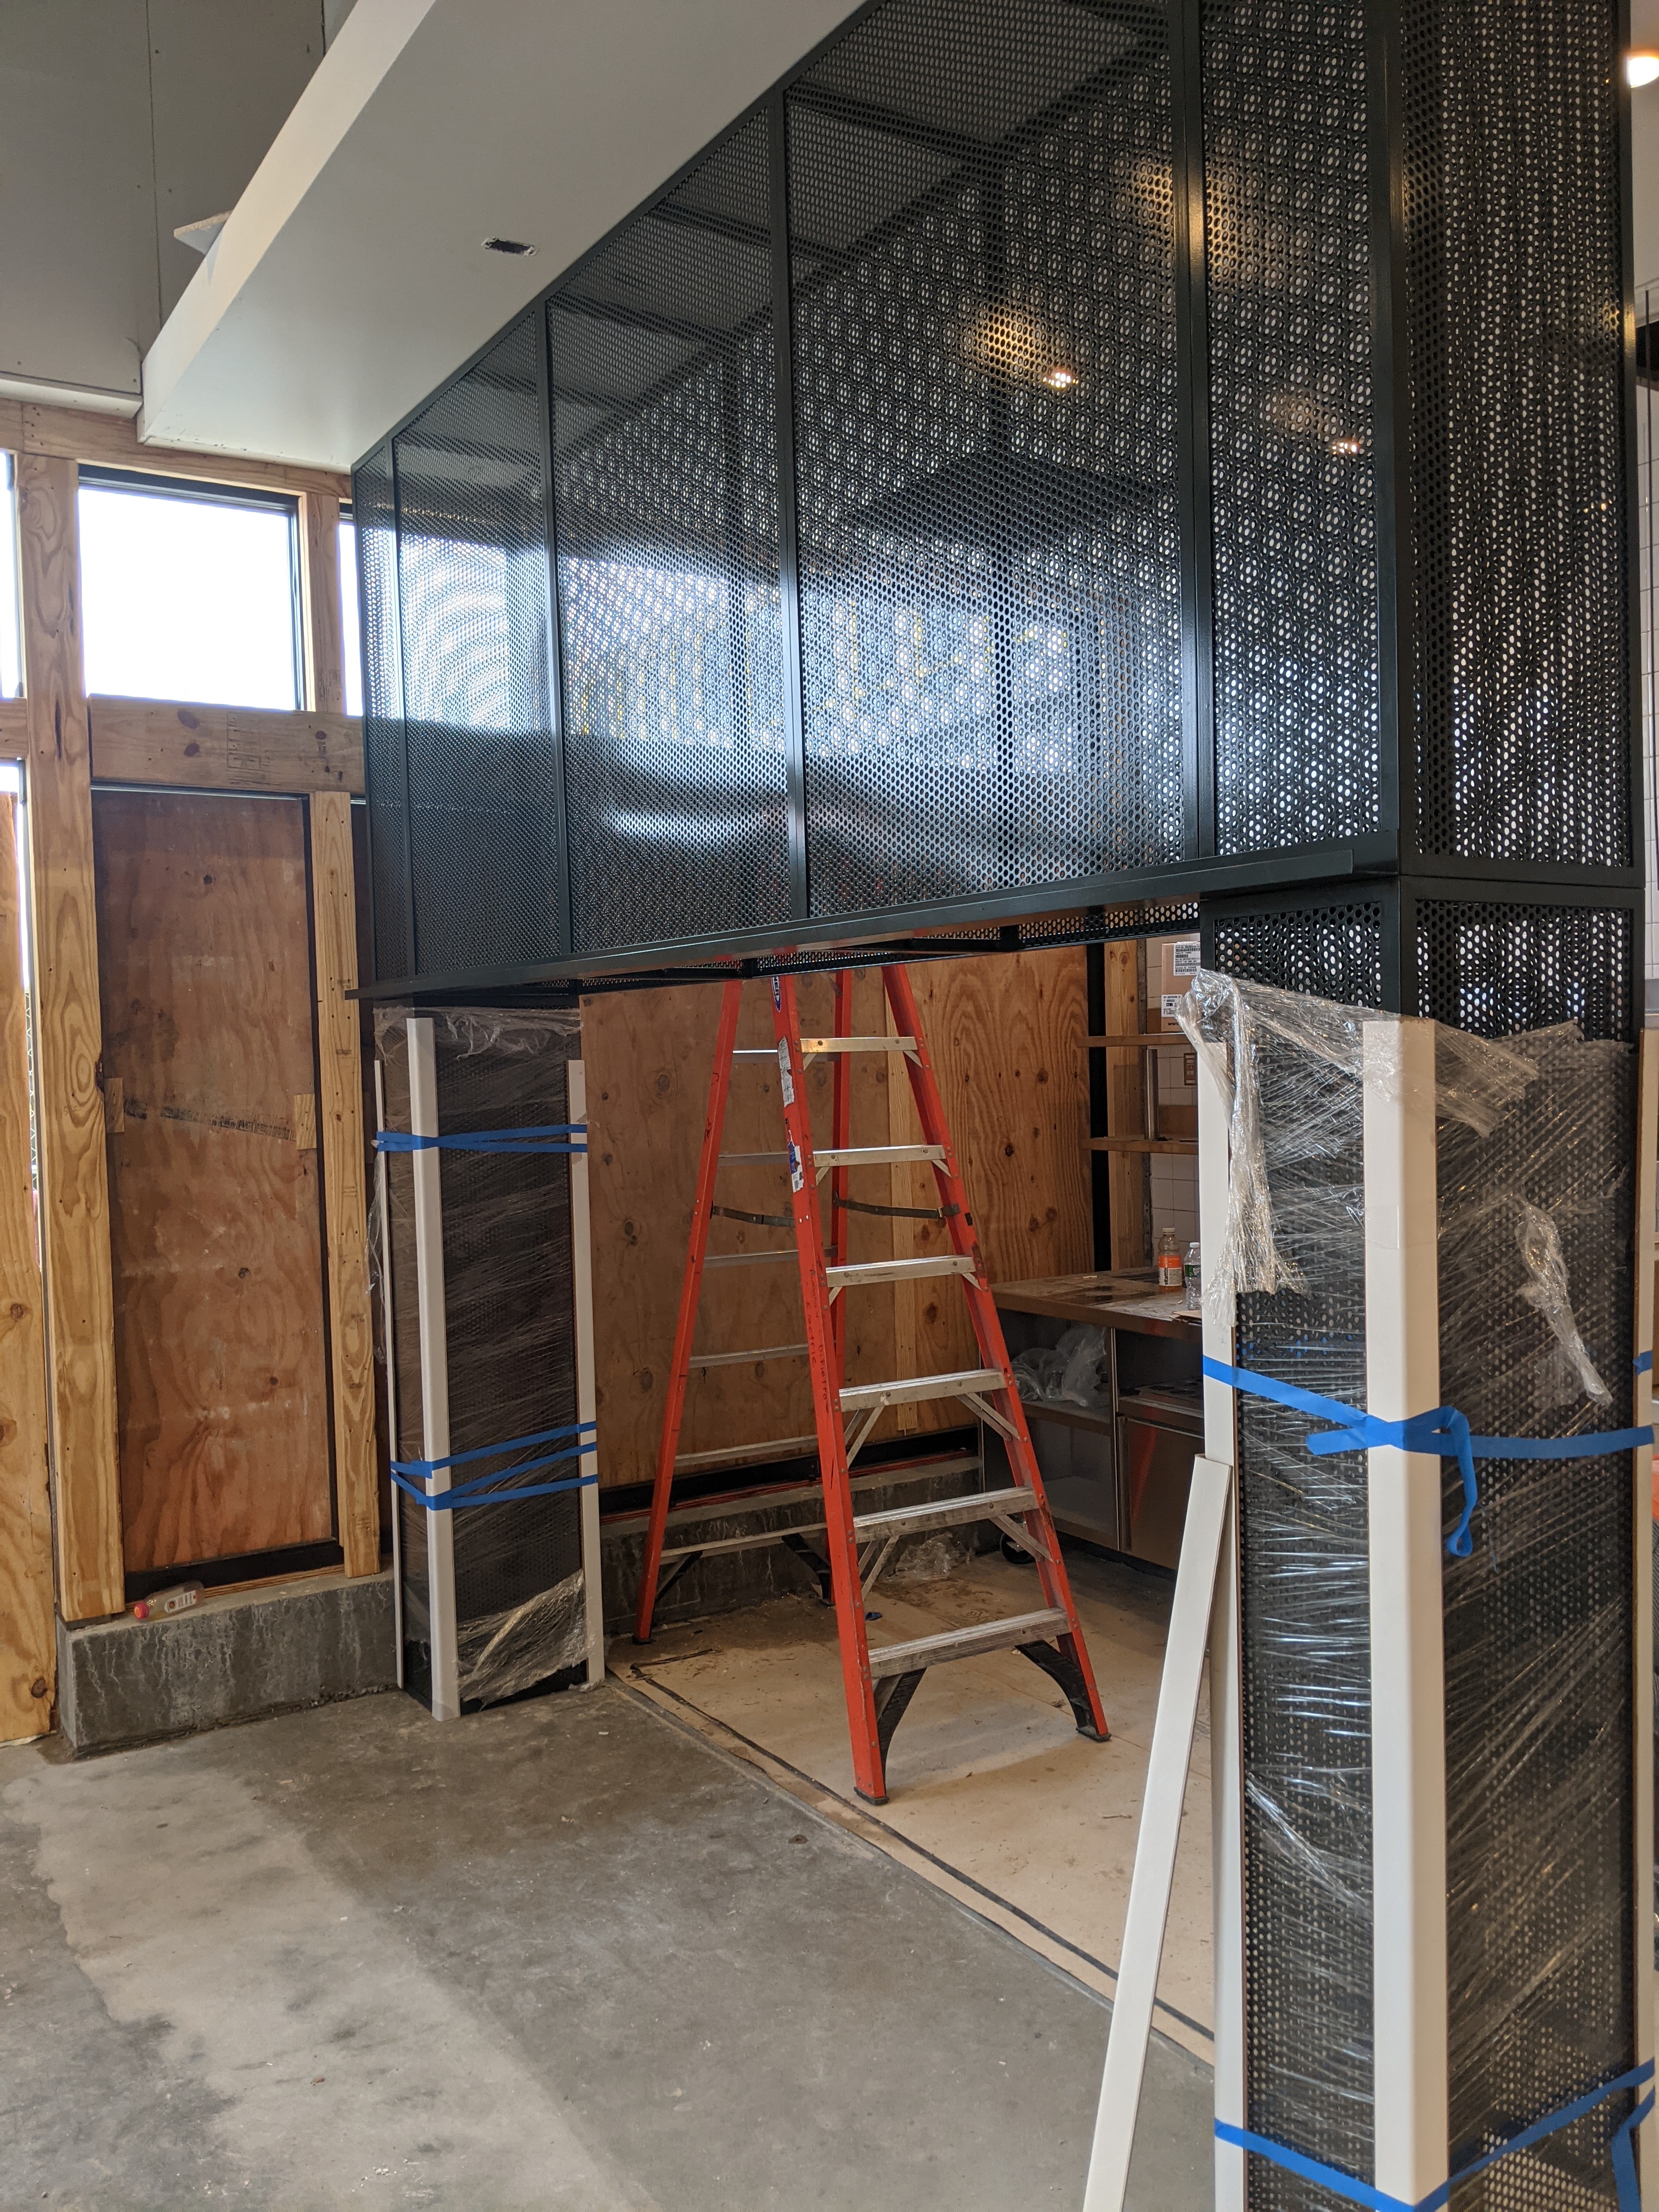
Process shots of building a reception counter. It was a relatively complicated build as the counter needed to sleeve over an existing cooler unit. I worked out the design of the tubing and component parts for this build in addition to leading the physical build. It was finished by clading it with steel sheet, and then the whole thing was powder coated.



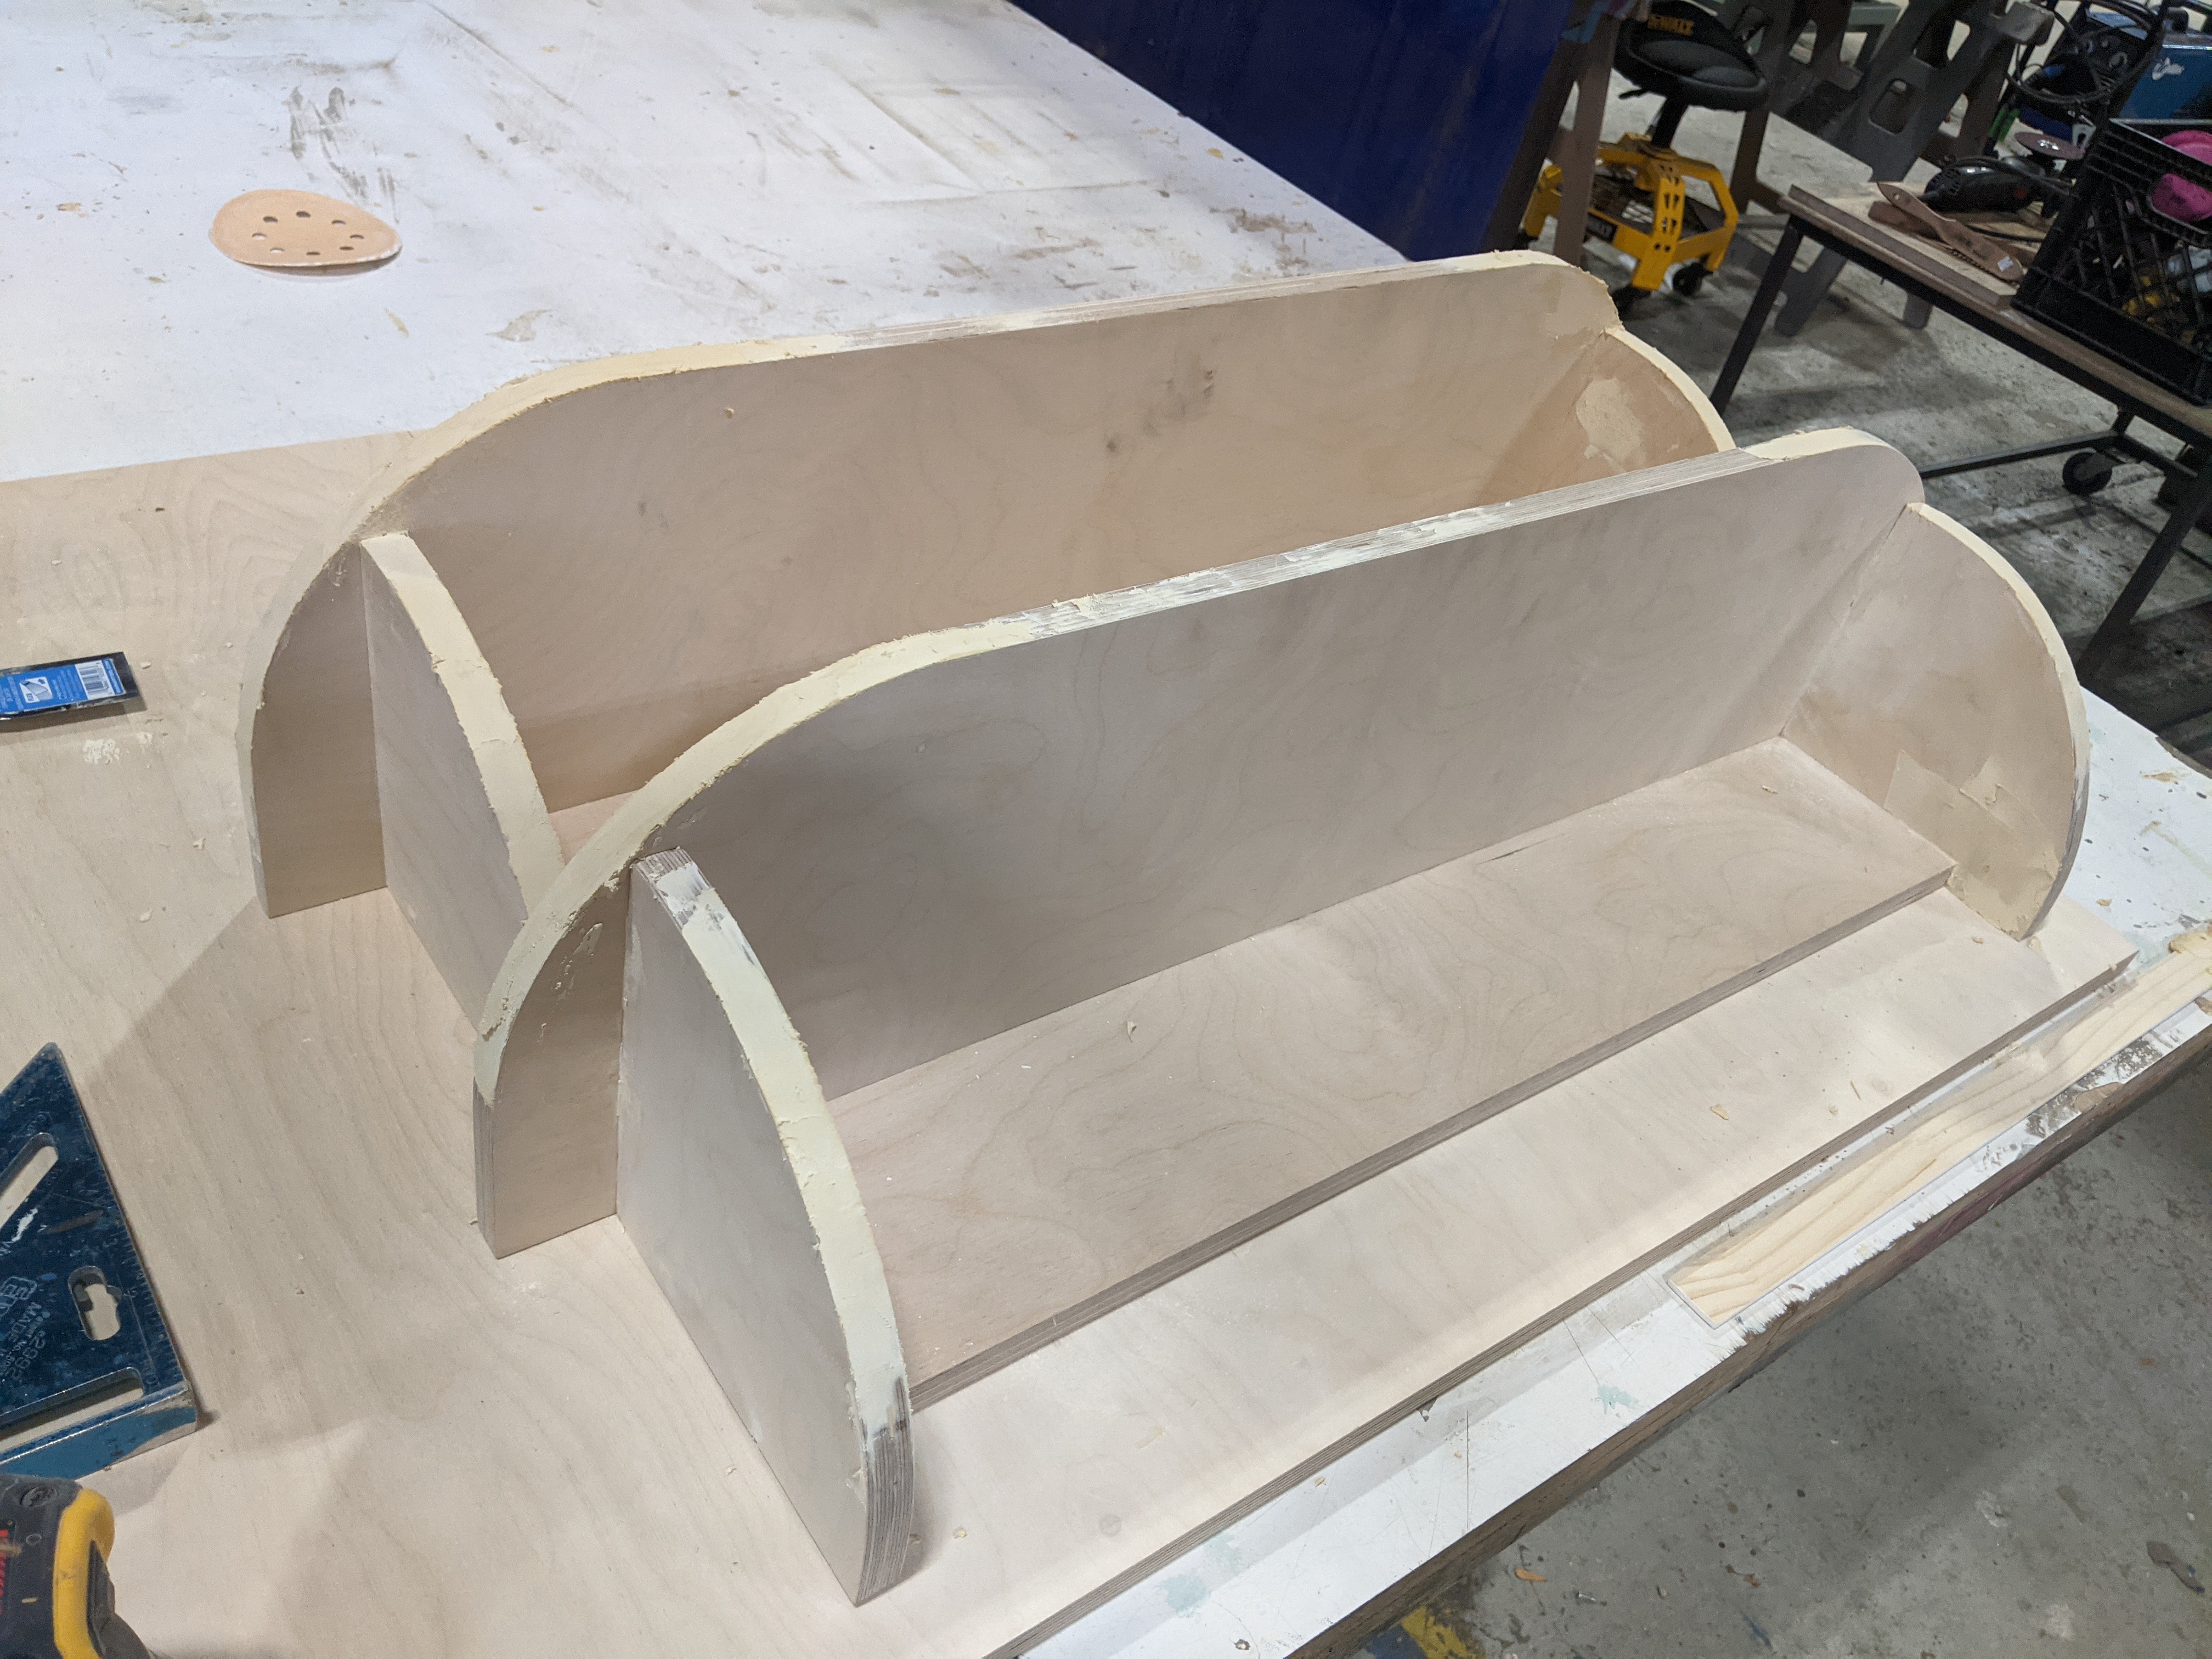
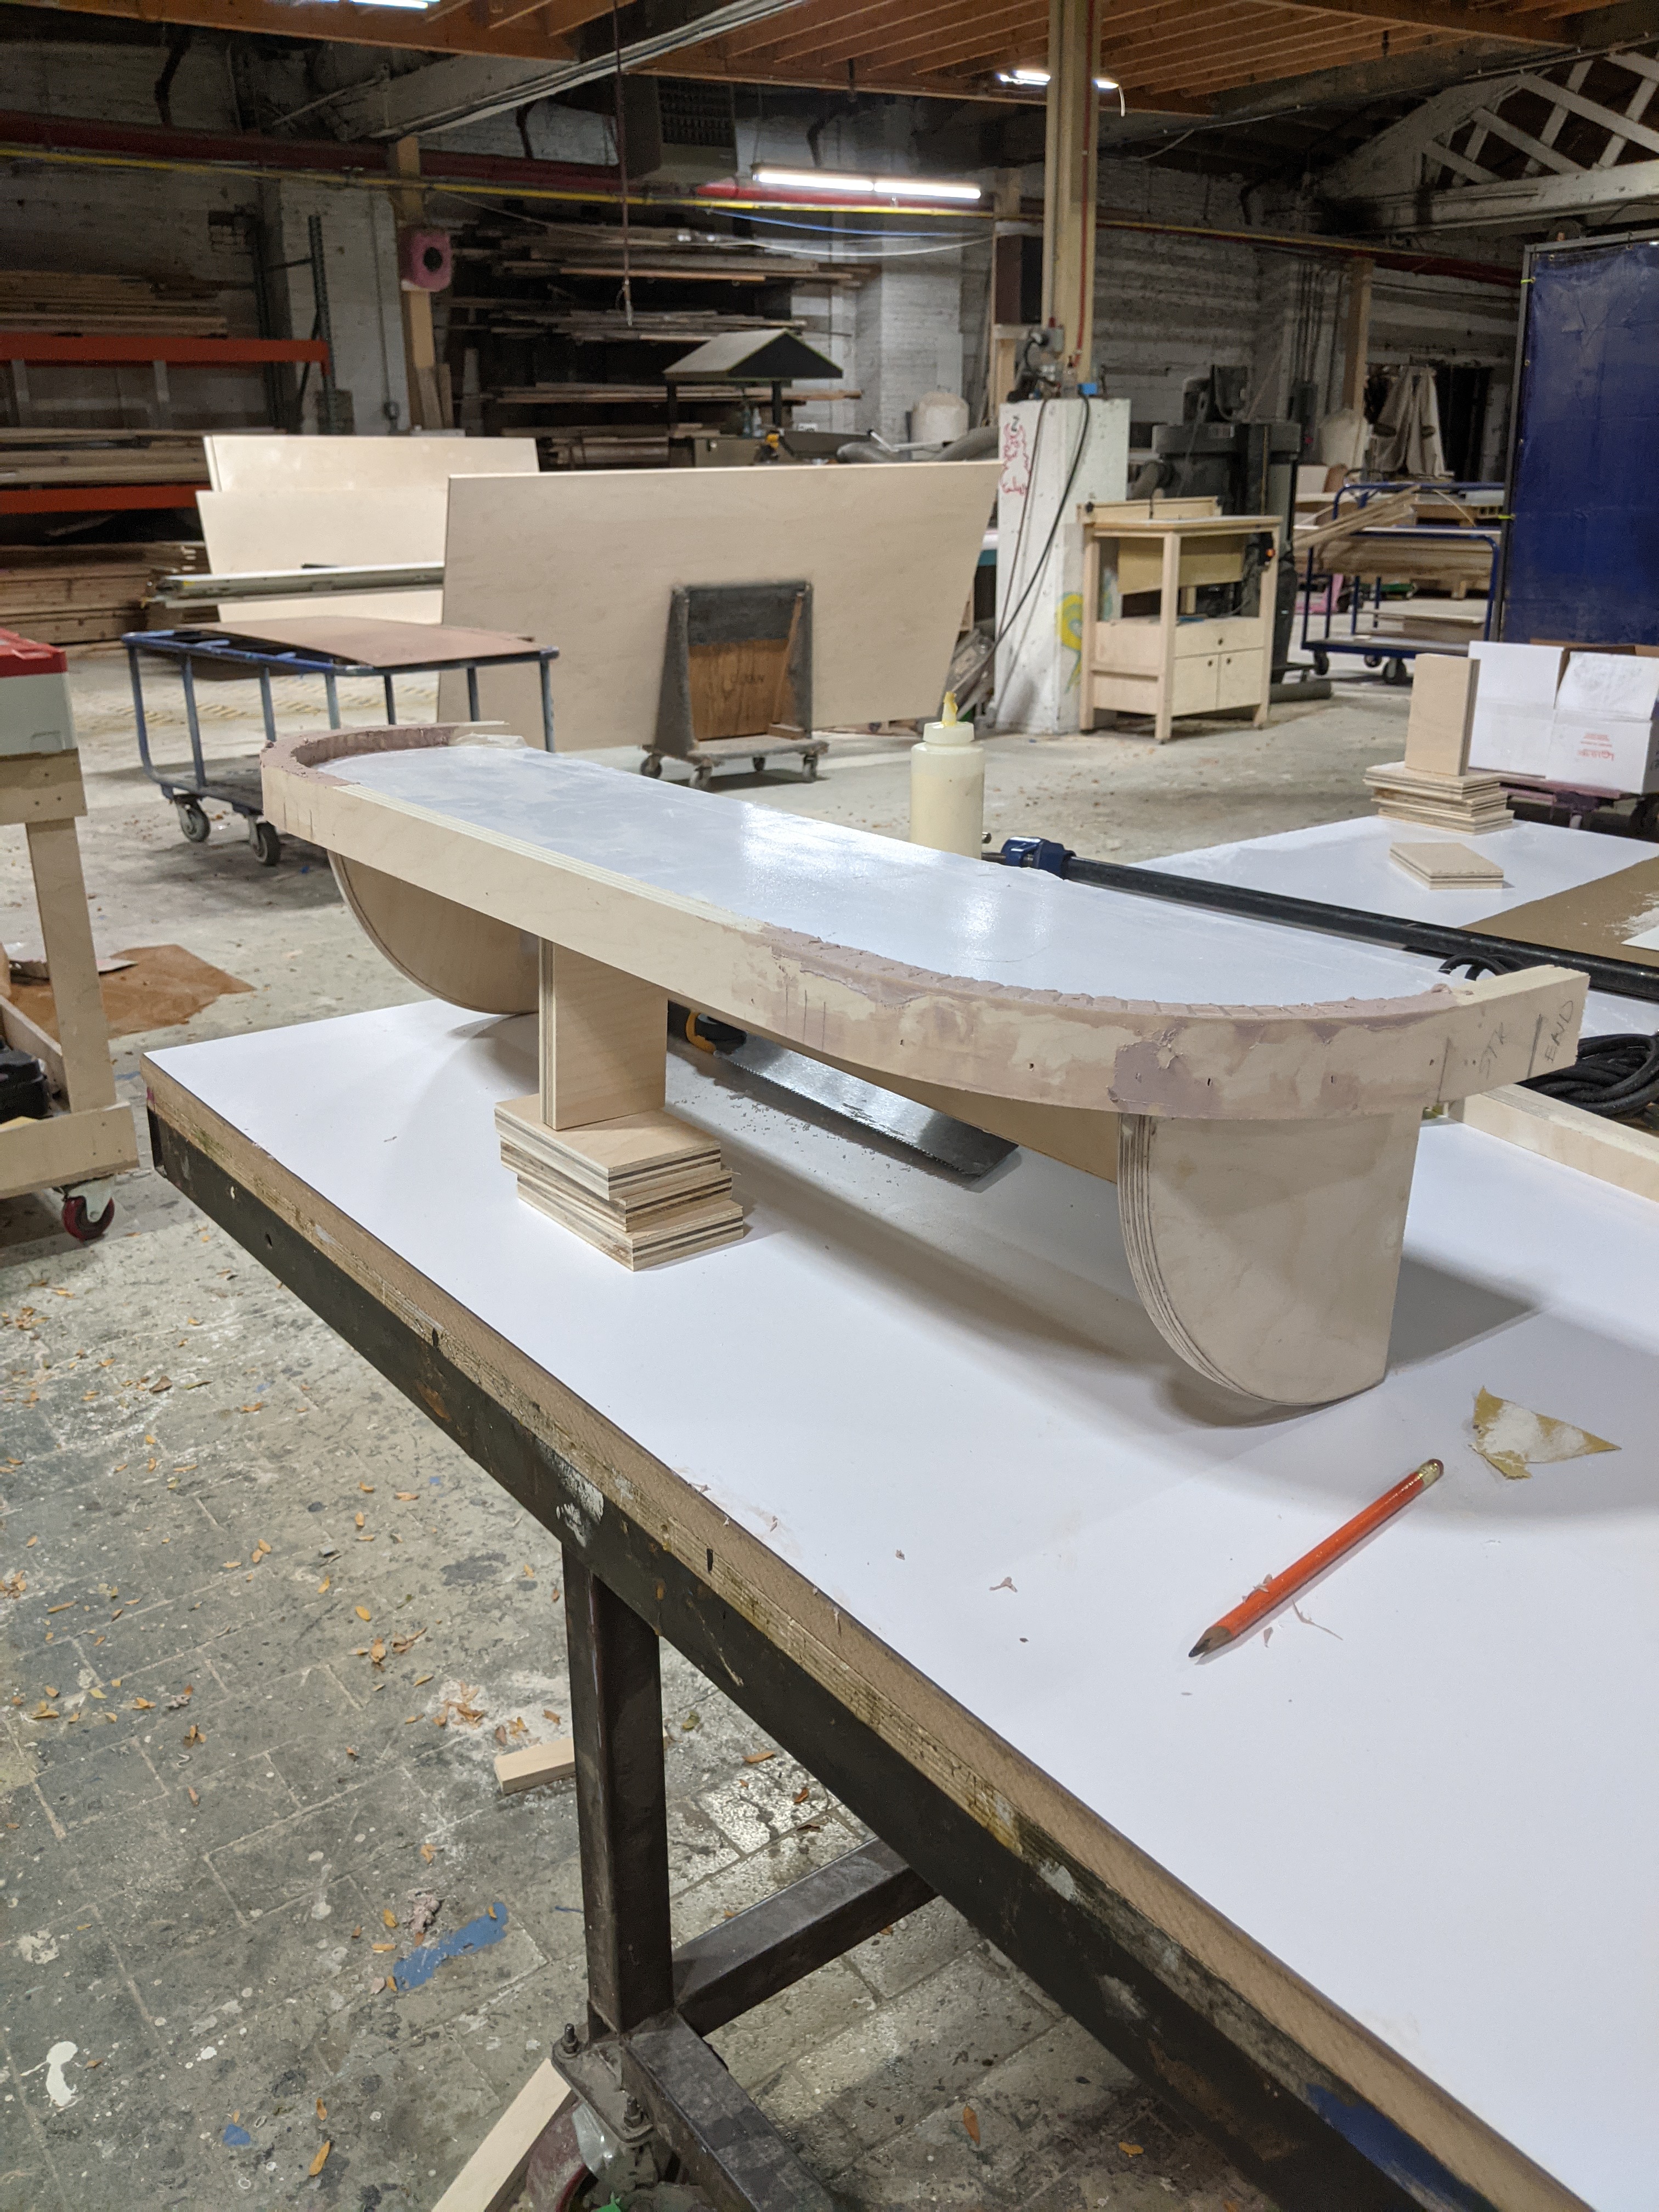
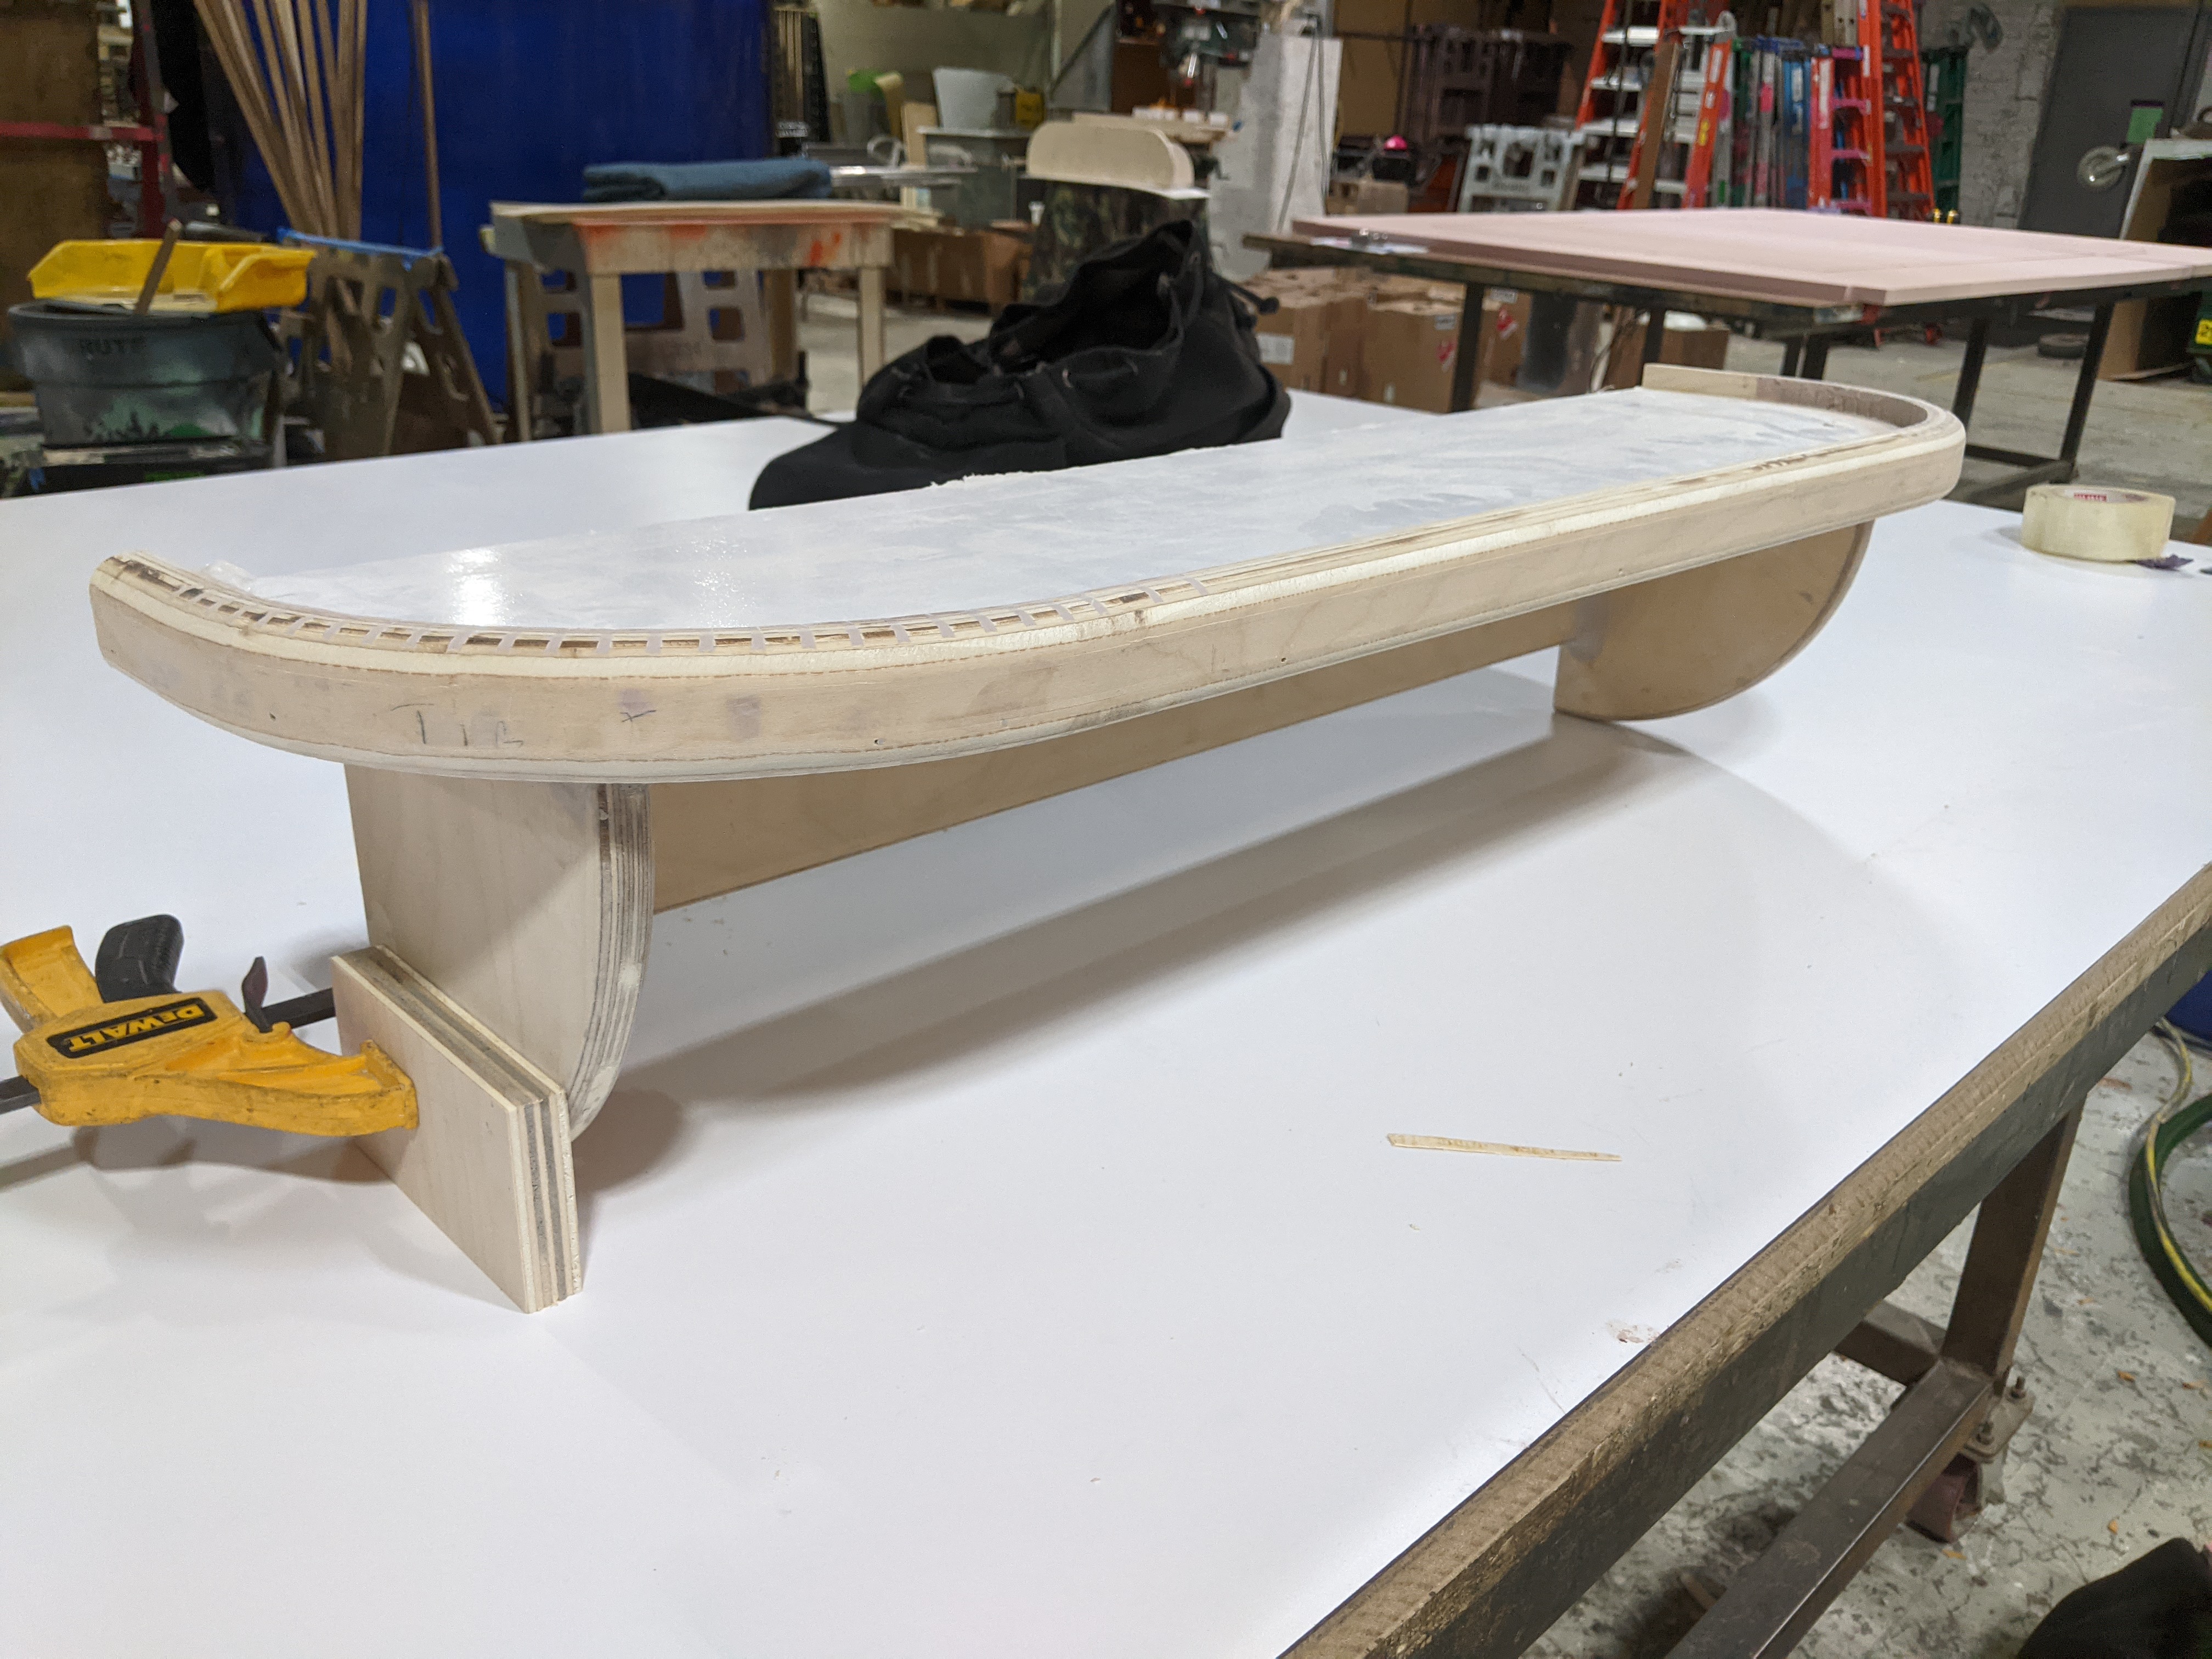
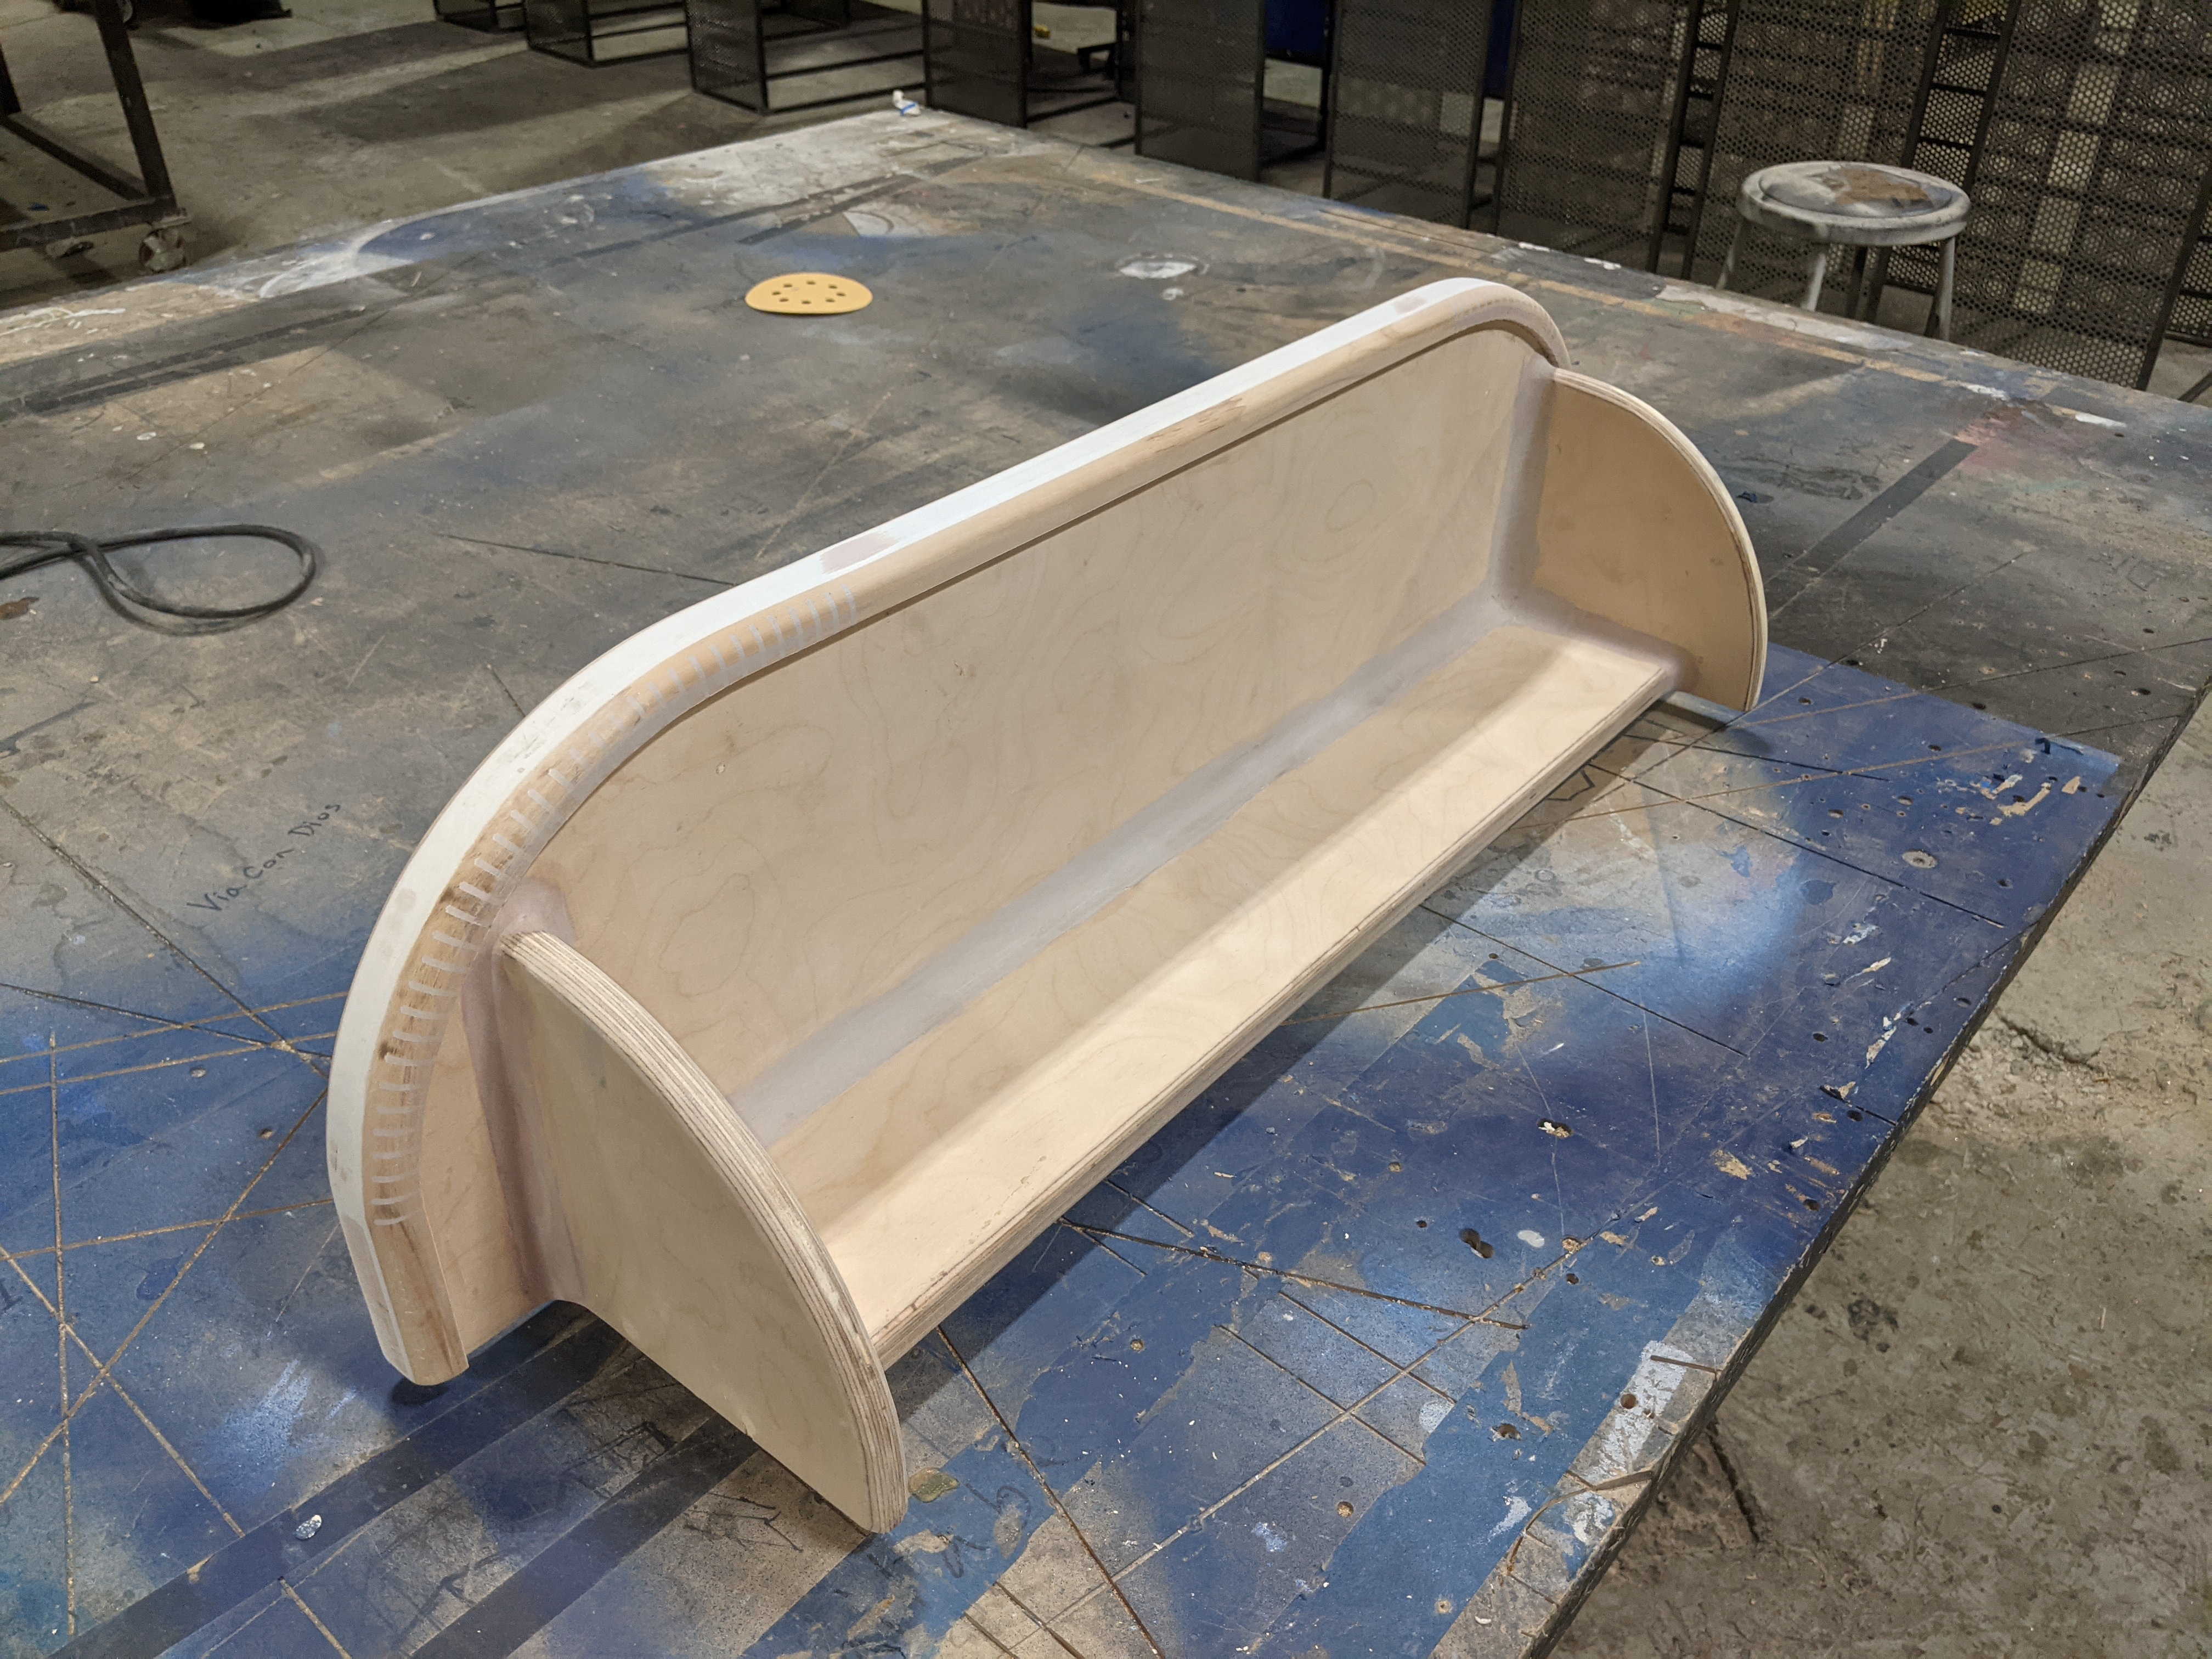
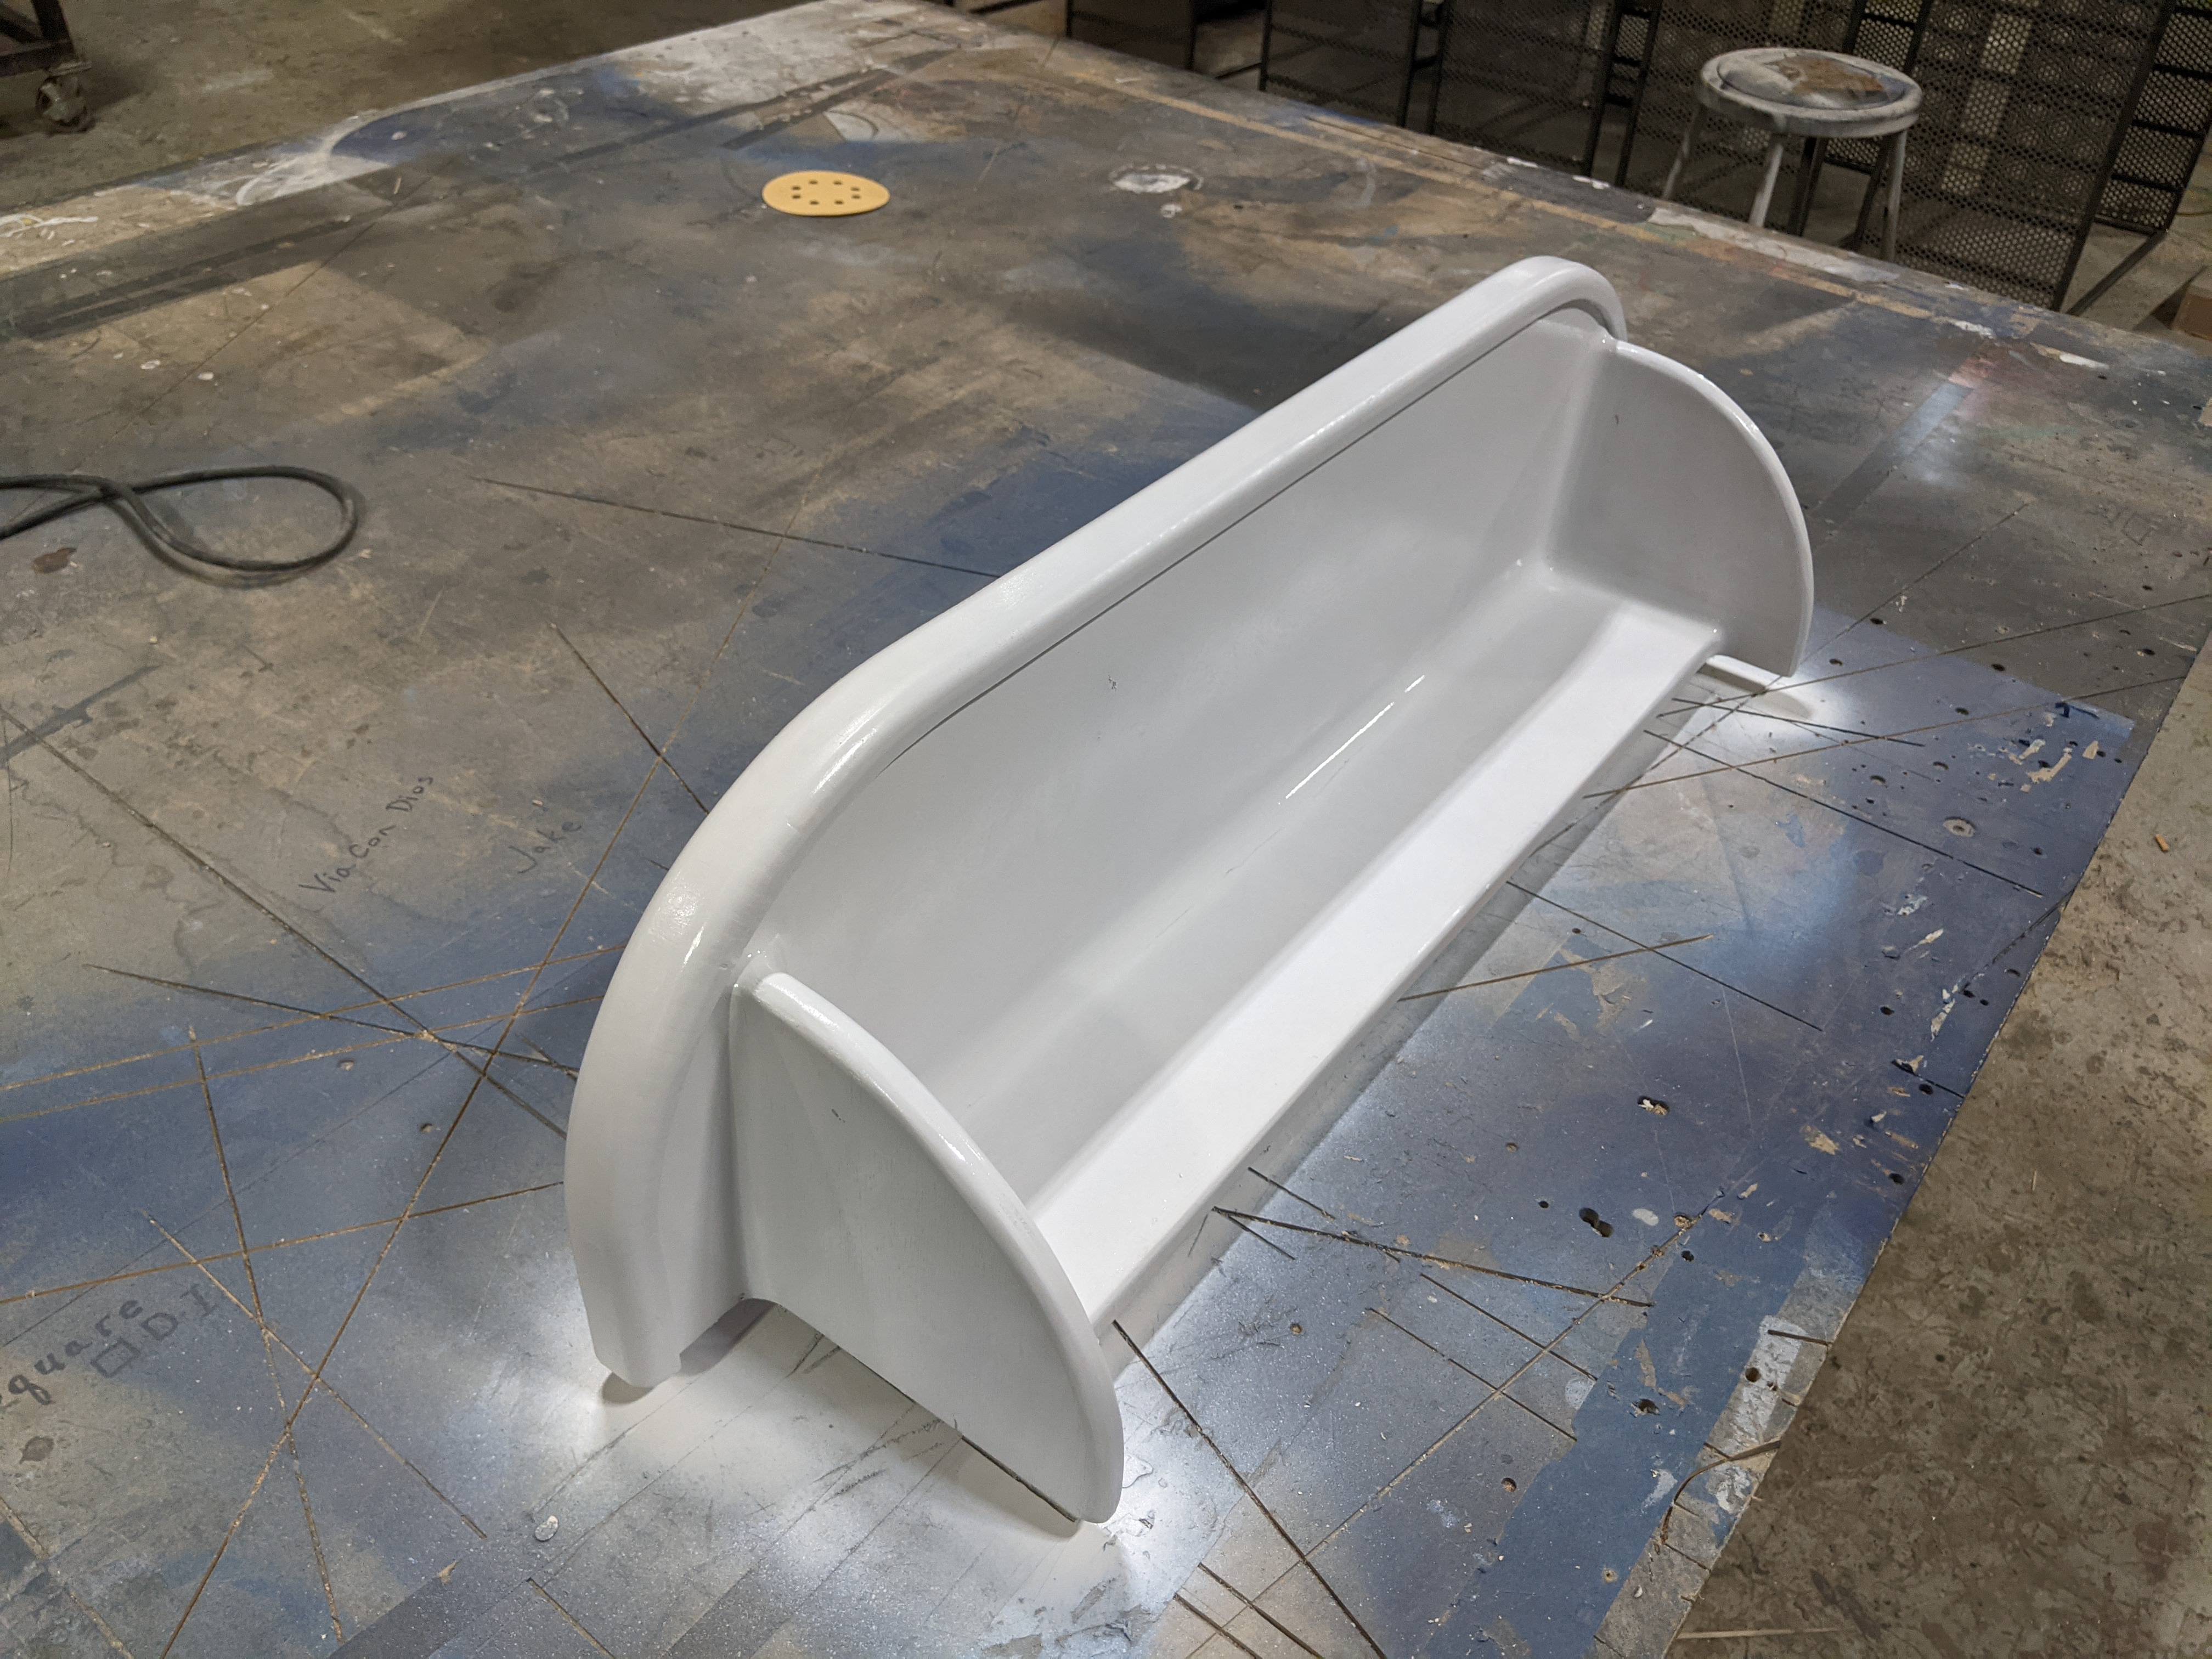
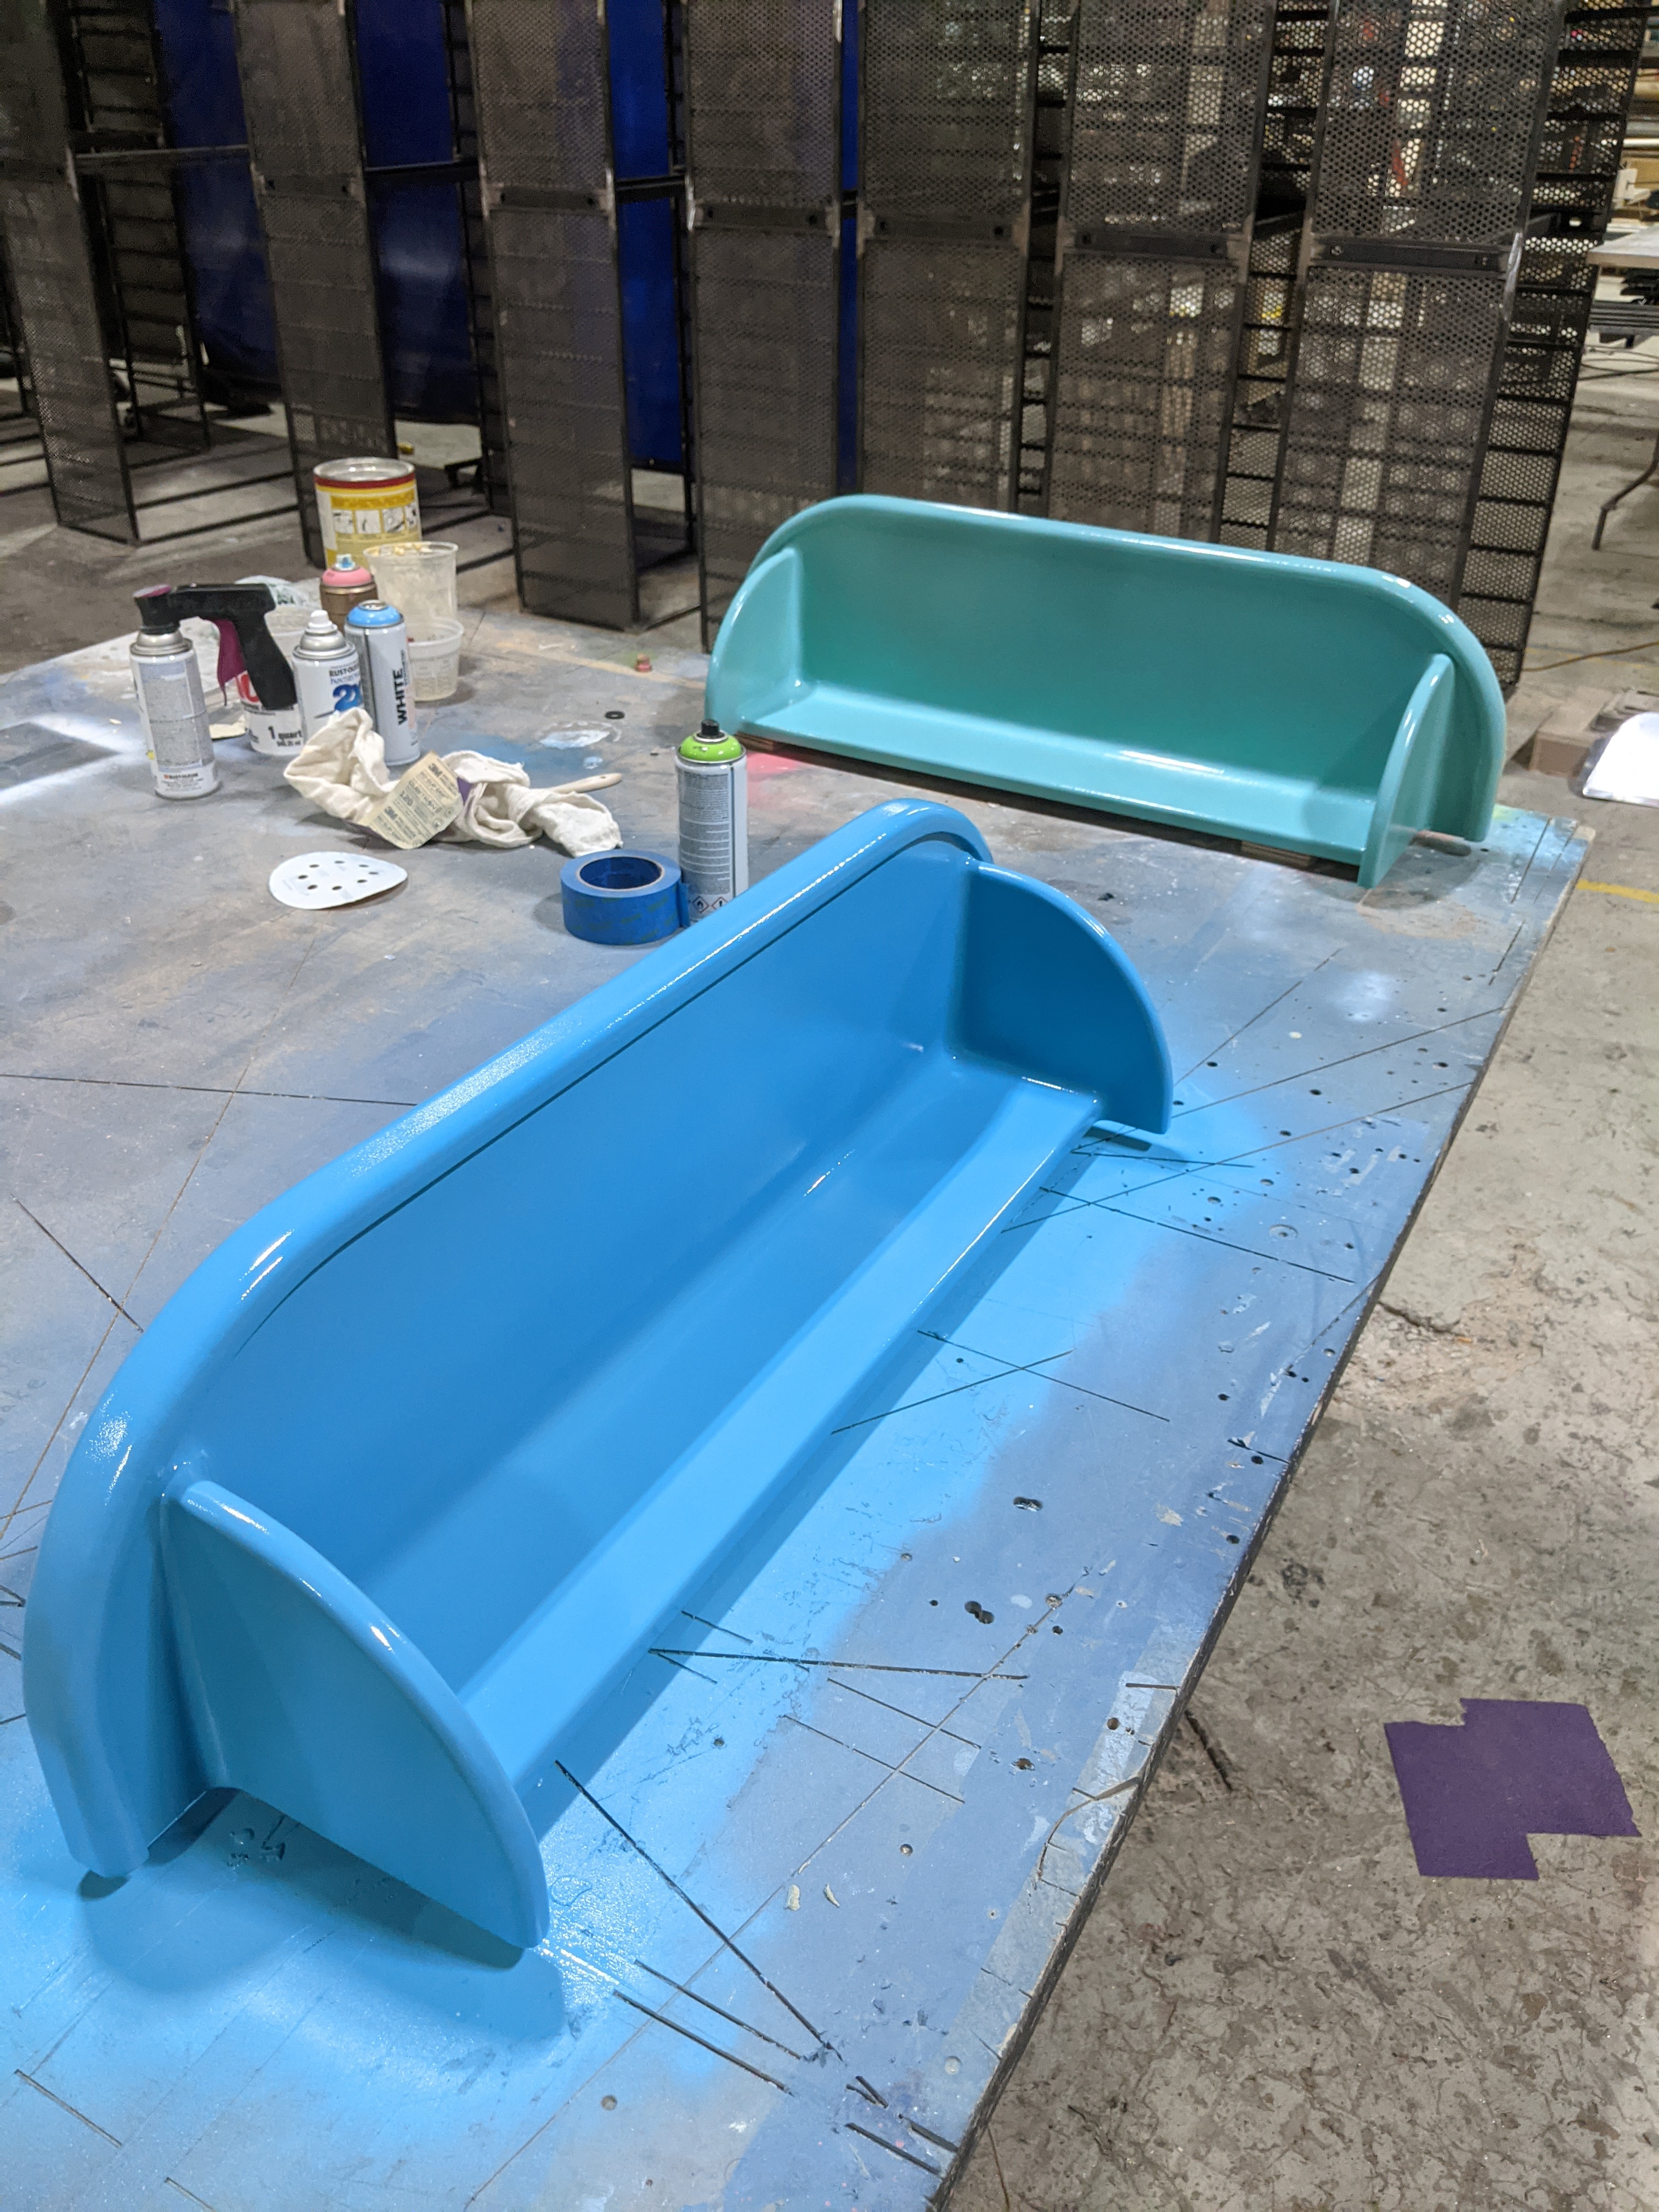
I made this rounded shelves for my wifes plants to sit on. The goal was to not have any hard edges on anywhere.
Round things are cute, and I think these turned out pretty well.
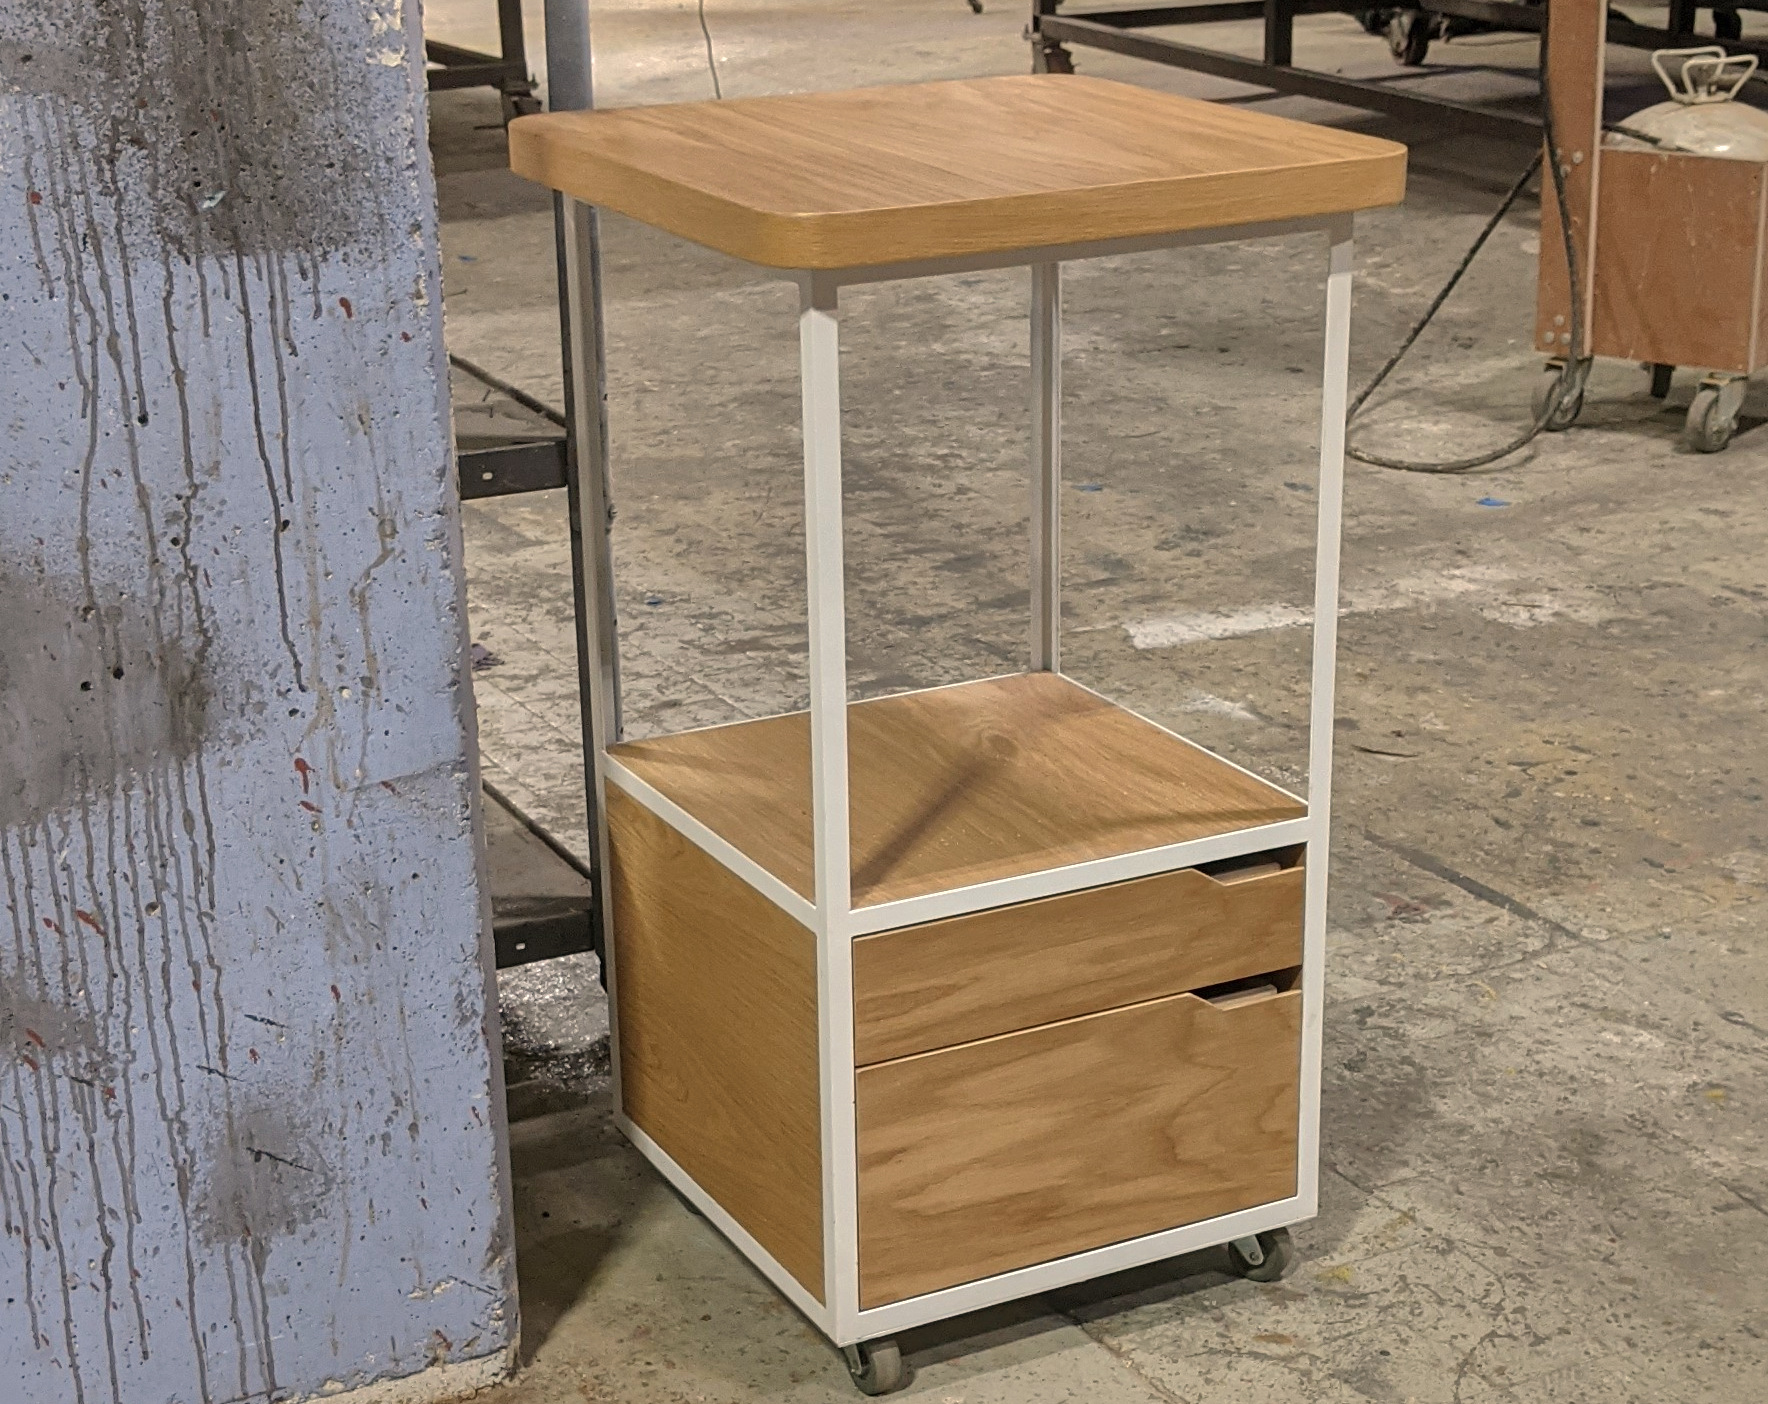
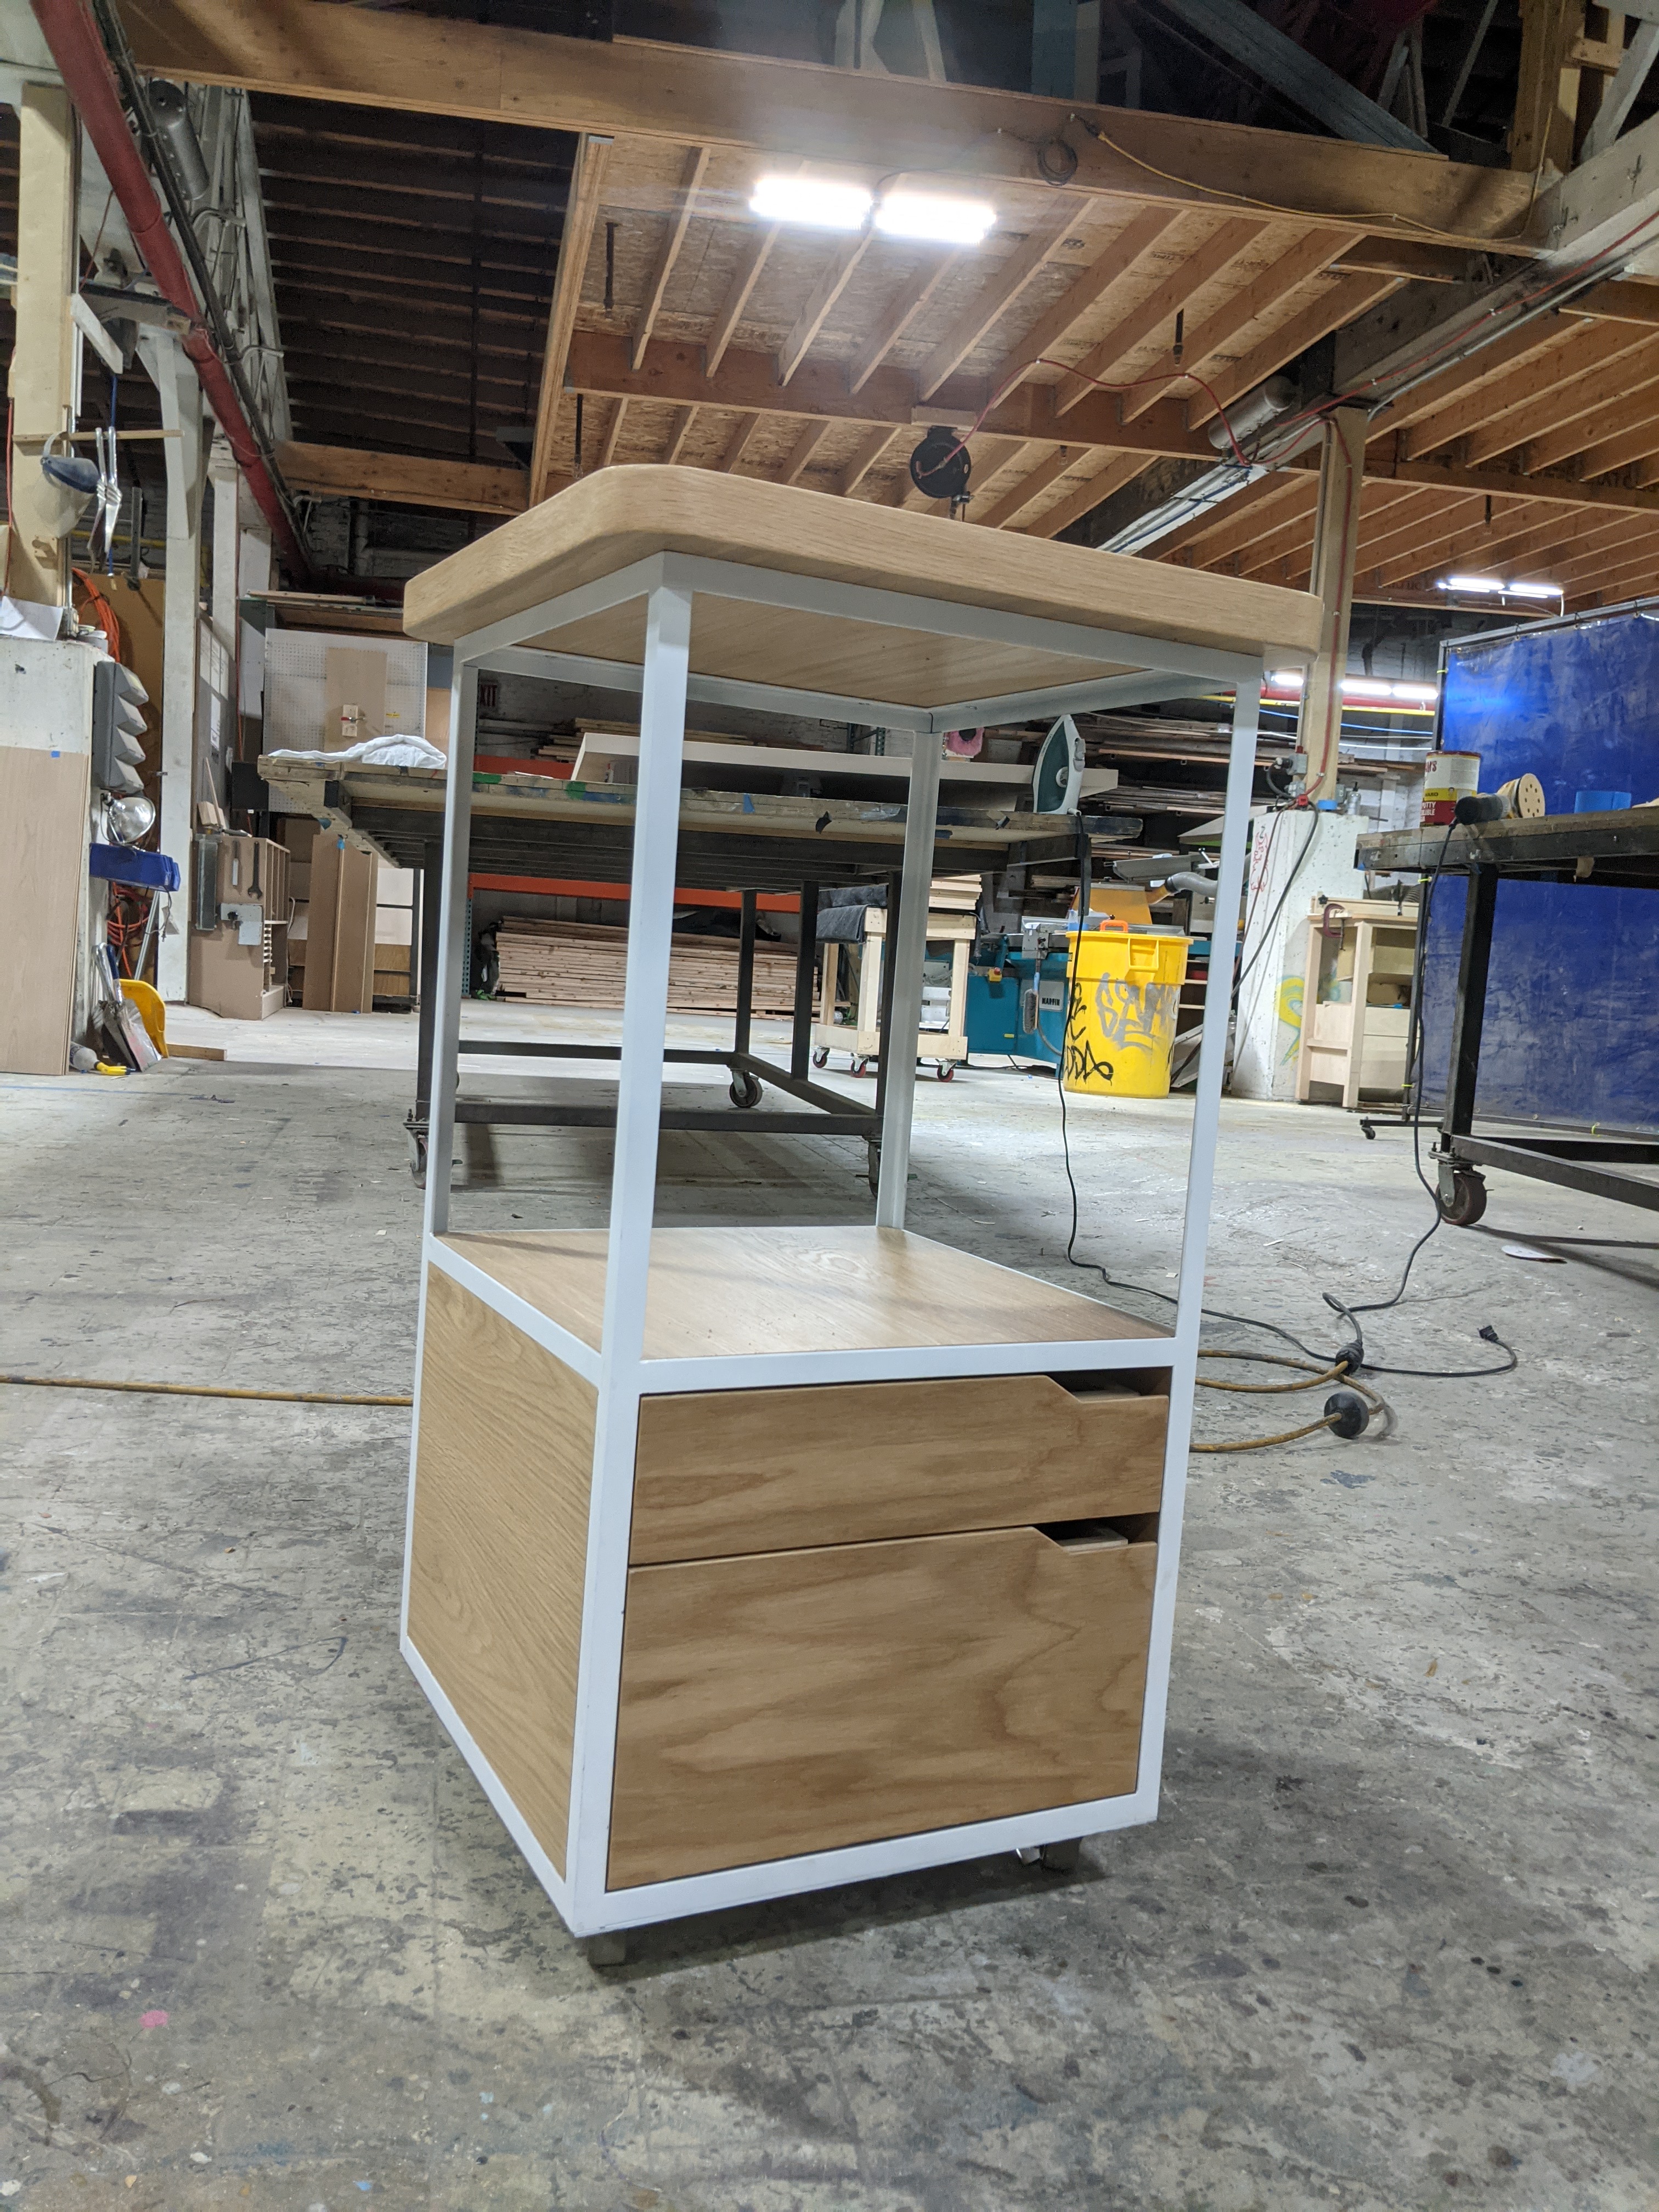
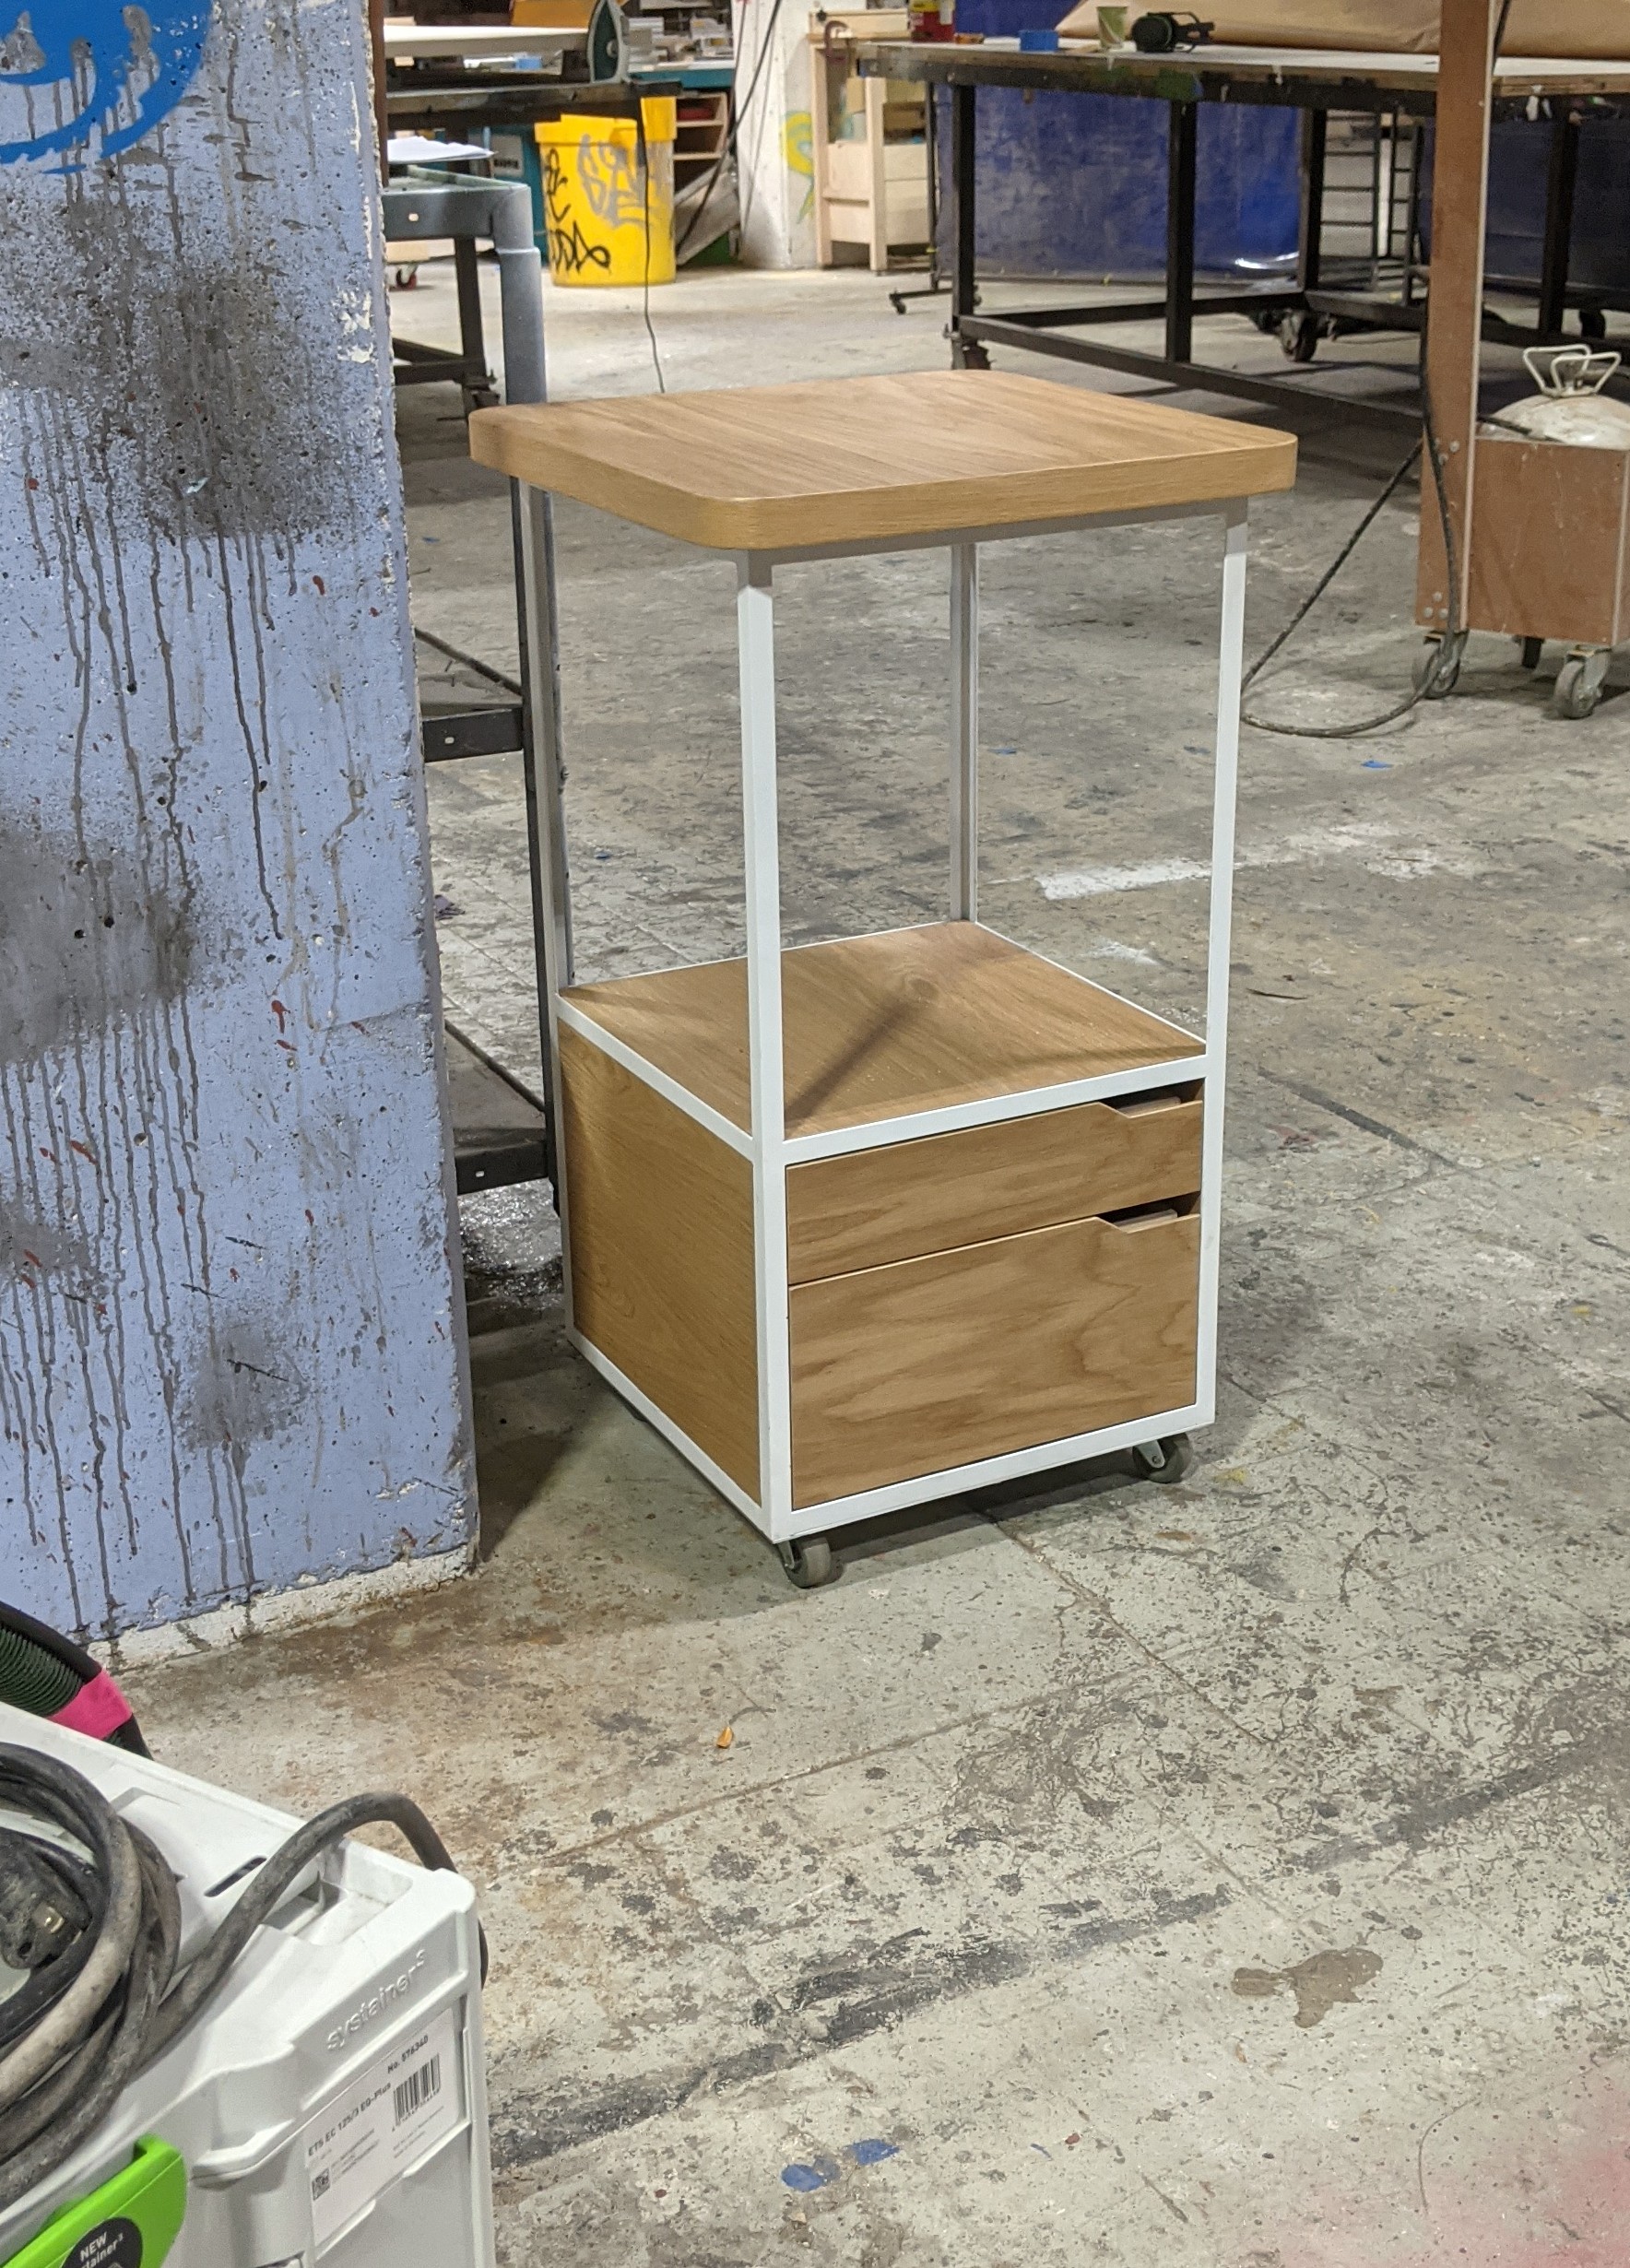
I built this cart to hold my 3d printers. It was designed to fit in a very small space when I lived in a much smaller apartment.
It gave me an opportunity to dry out that style of drawer pull, and to work with mixed materials. The bottom drawers hold printing filament and tools specifc to my printers

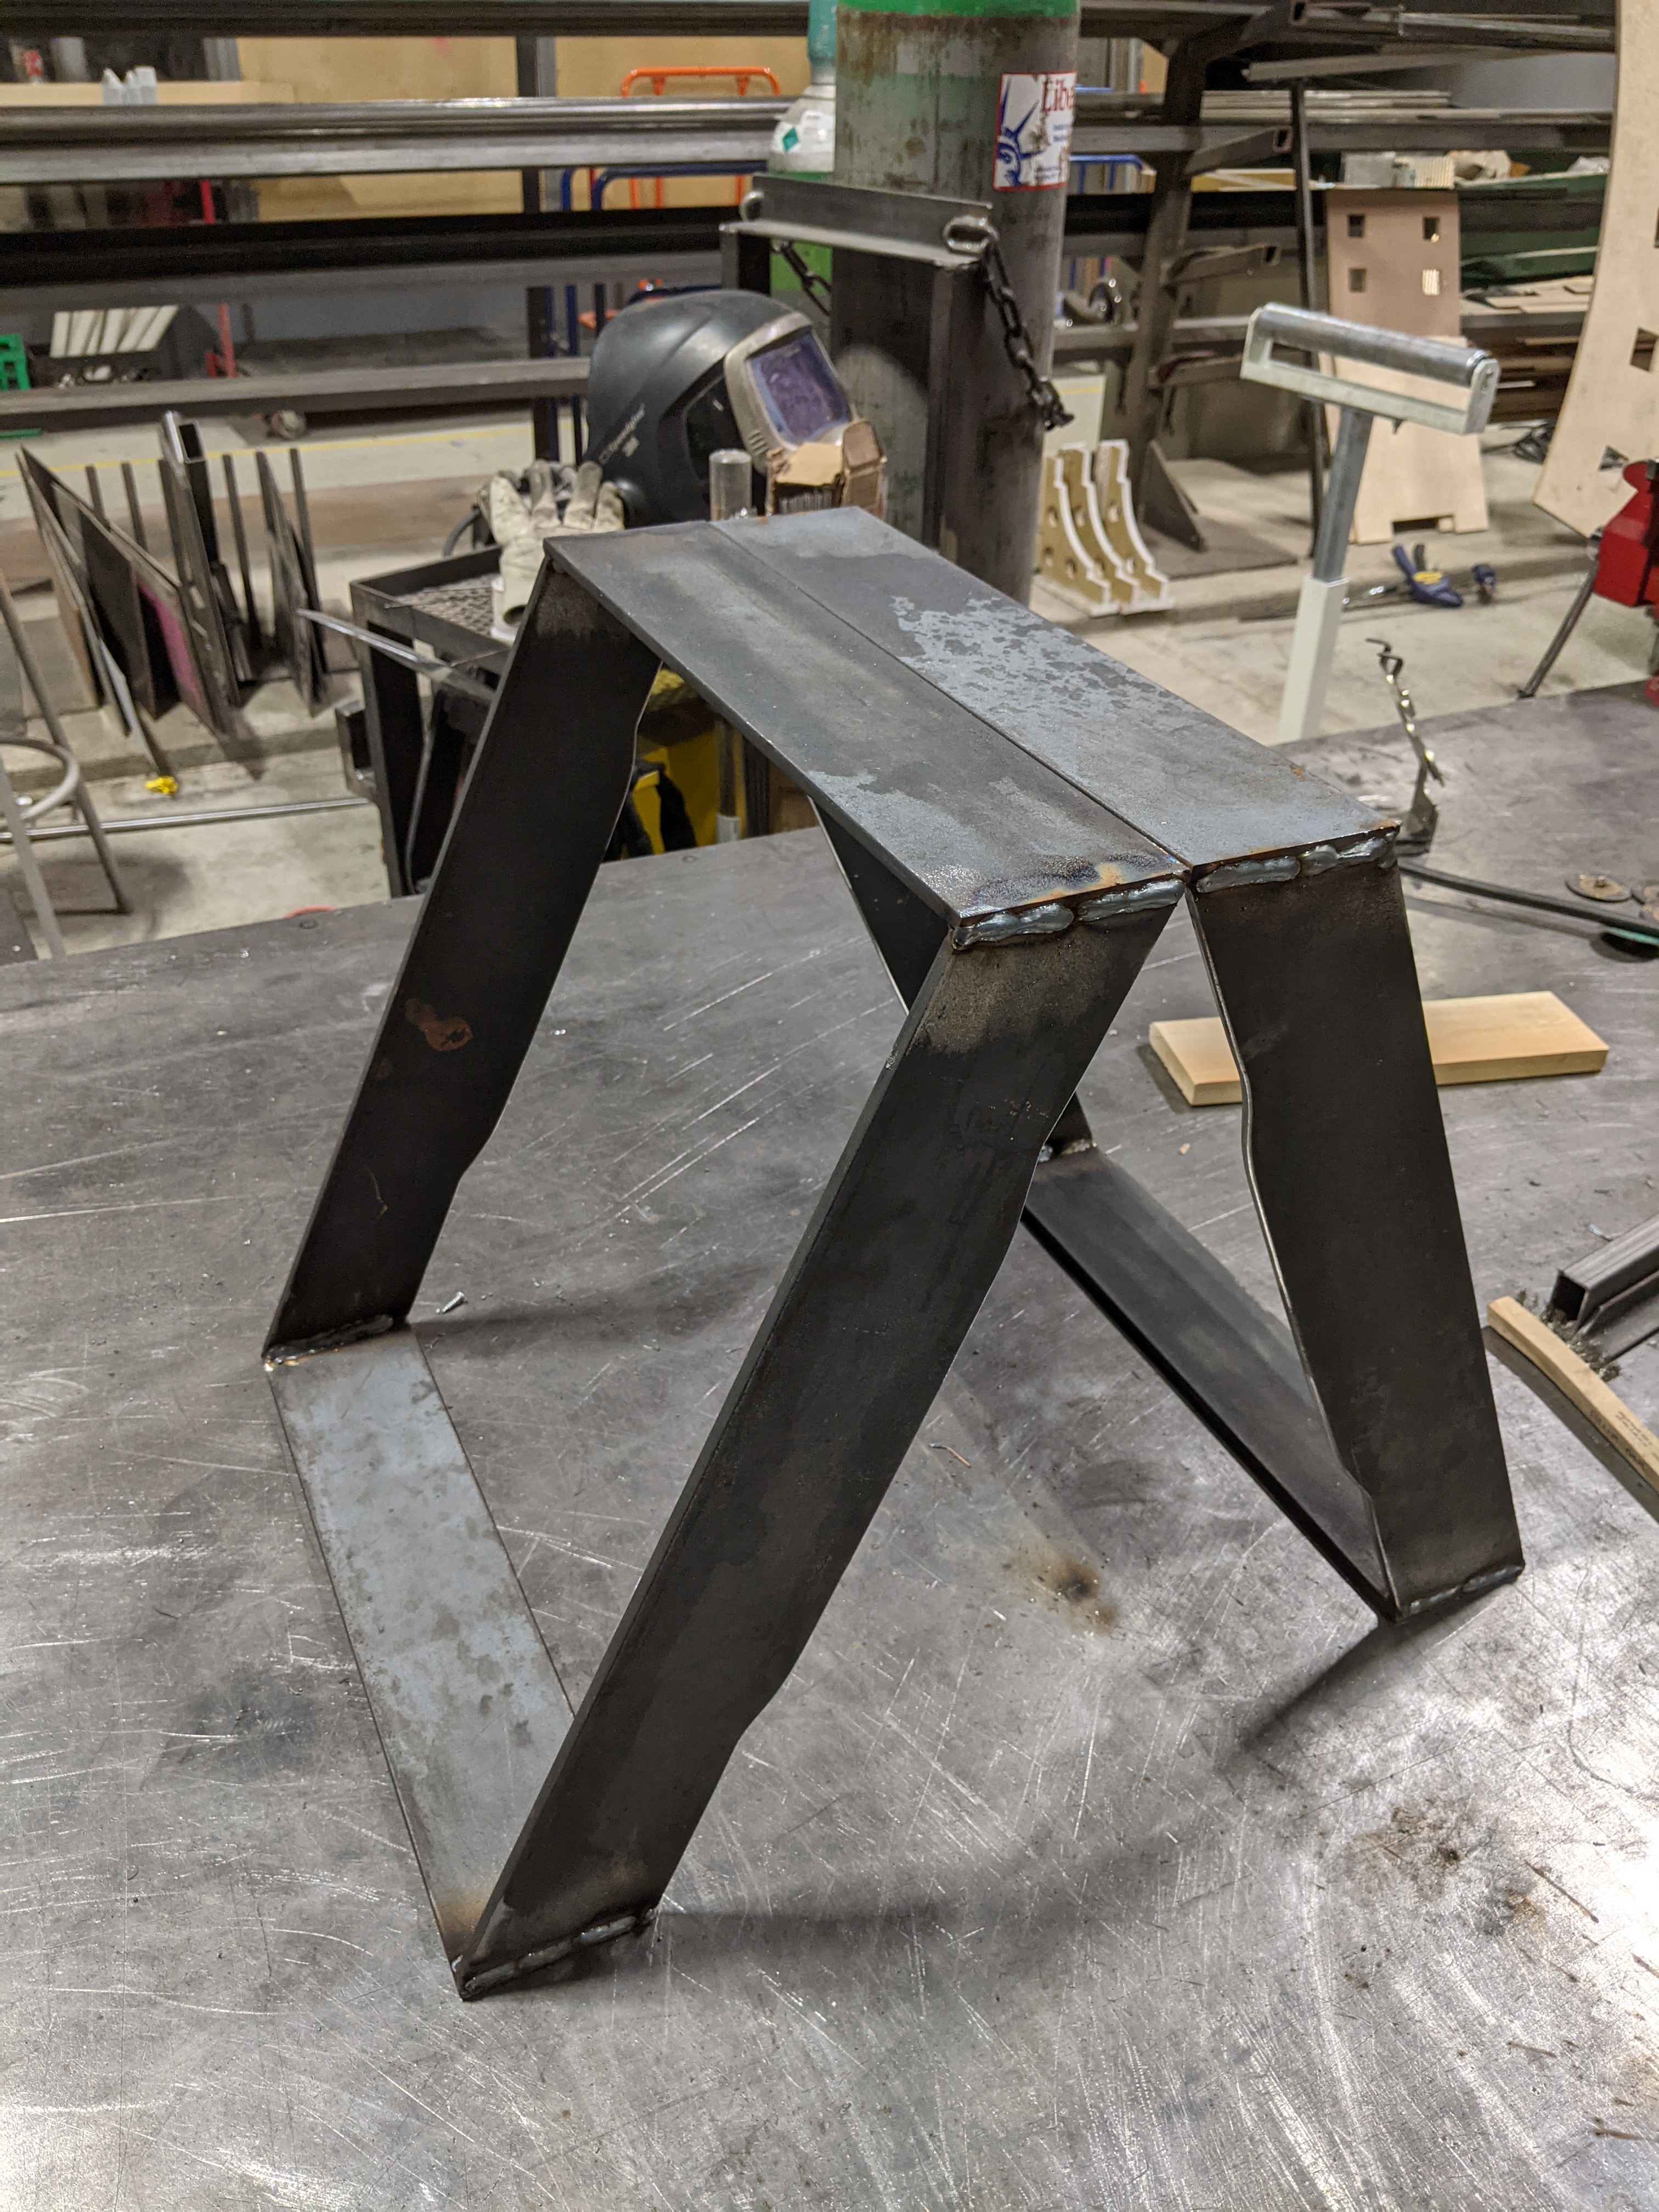
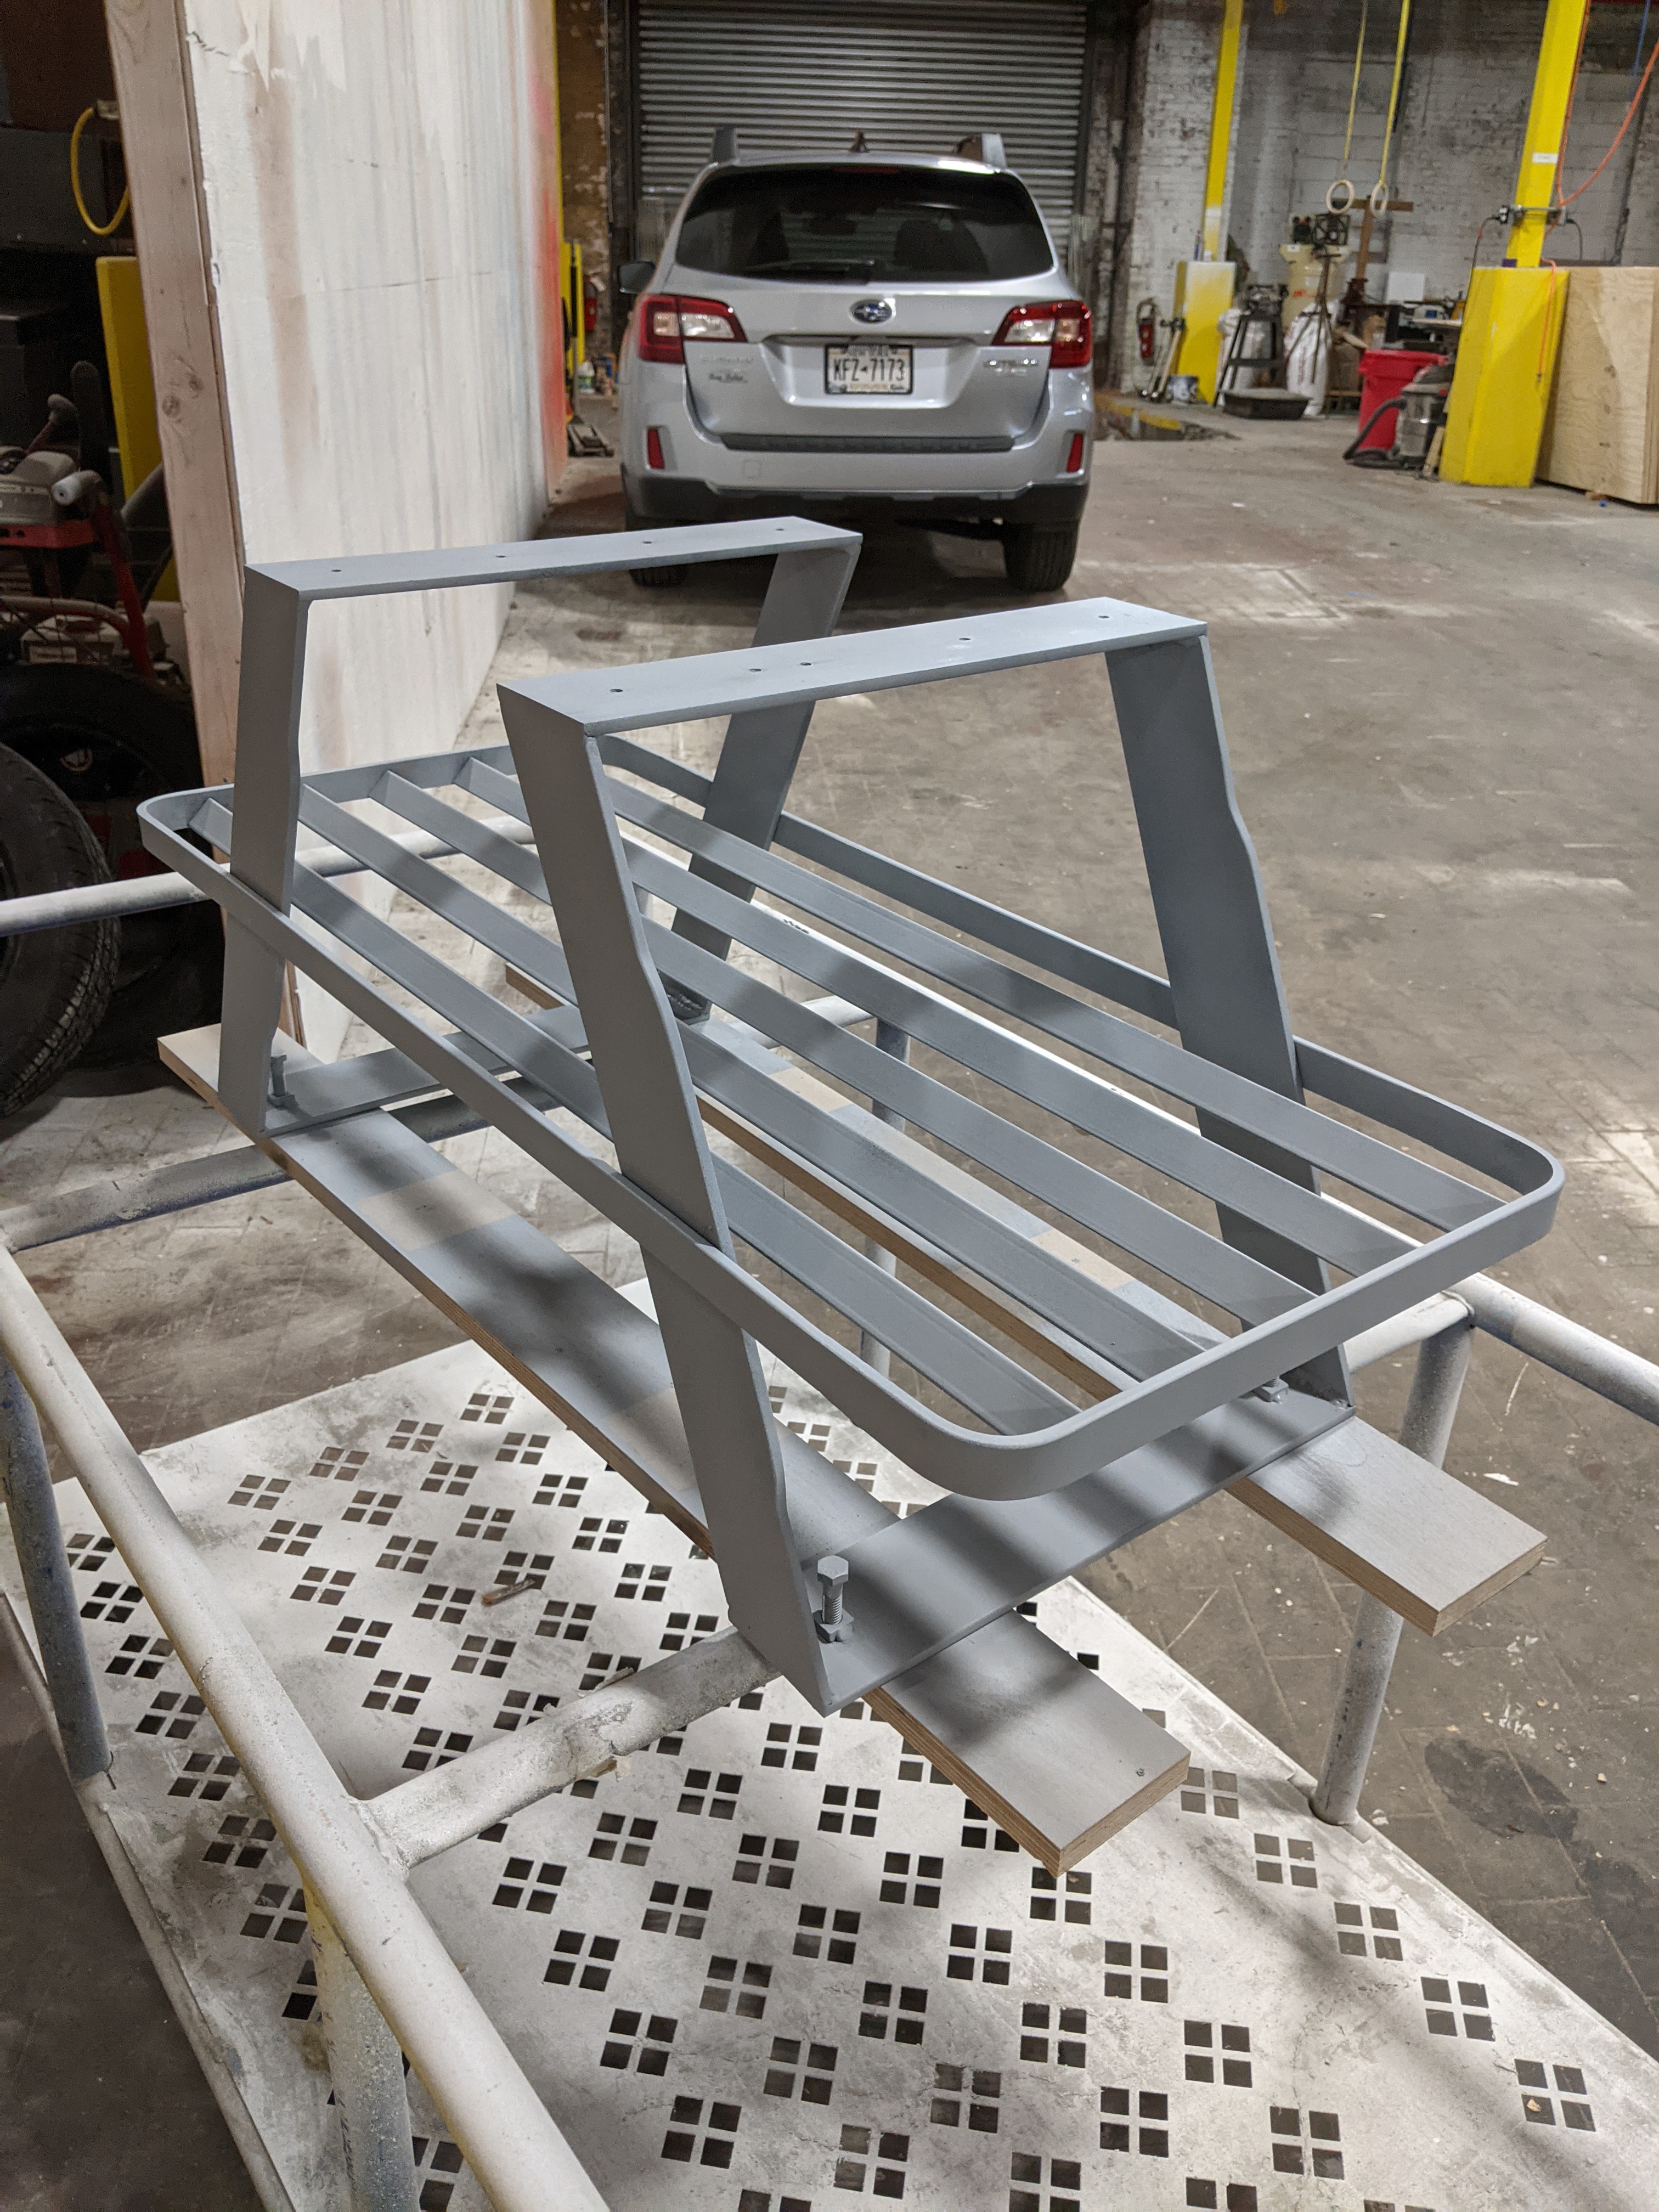
An idea I had for a slatted bench. The base was made out of steel bar and angle.
It was fun to make the bending jigs and forms to get the rounded edges of the shoe rack. It still looks great after several years of sitting by our front door.
